
 Redakshon

Kralendijk,- Despues di e reforma konstitushonal di Karibe Hulandes na 2010 ta kompará e seis islanan ku ta forma Karibe. Tópikonan ku ta wòrdu kubri ta inkluí poblashon, labor, edukashon, ekonomia i turismo. Ademas di e situashon aktual, ta analisá desaroyonan durante añanan 2010-2025.
*E outornan ta gradisí Sabrina de Regt pa su koperashon ku e artíkulo aki.
** E artíkulo aki tambe ta optenibel na ingles i hulandes.

1. Introdukshon
Riba 10 di òktober 2010, un reforma estatal di e Reino Hulandes a tuma lugá. Riba e fecha aki, a disolvé e pais ‘Antia Hulandes’. Na e momentu ei, Antia Hulandes tabata konsistí di sinku isla: Kòrsou, Sint Maarten, Boneiru, Sint Eustatius i Saba. Anteriormente, Aruba tambe tabata parti di Antia Hulandes, pero na 1986 el a haña e ‘status aparte’. Esaki tabata nifiká ku nan a bira un pais independiente, pero ketu bai tabata parti di e Reino Hulandes, sí.
For di e transishon estatal na 2010, Reino Hulandes ta konsistí di kuater pais: Kòrsou, Aruba, Sint Maarten i Hulanda. E promé grupo di pais tambe tin biaha ta indiká ku e abreviashon ‘paisnan CAS’. E pais Hulanda ta konsistí di un parti oropeo i un parti karibense. Hulanda Karibense ta konsistí di e Entidatnan Públiko Boneiru, Sint Eustatius (na ingles: Statia) i Saba. Pa e tres islanan aki tambe sa usa e término ‘munisipionan spesial’ i e abreviashon ‘islanan BES.’ E seis islanan huntu tambe nos sa yama Karibe Hulandes.
For di e reforma estatal riba 10 di òktober 2010, Ofisina Sentral di Statistik (CBS) ta responsabel pa suministro di informashon estadístiko tokante e tres islanan di Karibe Hulandes (Boneiru, Saba i Sint Eustatius). Pa duna kontenido na e responsabilidat aki tambe a redaktá un meerjarenprogramma (programa di vários aña). Tambe, CBS periódikamente ta publiká sifra tokante Hulanda Karibense riba StatLine pa un kantidat amplio di tema. E paisnan CAS kada un tin su propio ofisina di statistik: Central Bureau of Statistics Curacao, Central Bureau of Statistics Aruba i na Sint Maarten e Department of Statistics.
For di e reforma estatal, e publikashonnan tekstual di CBS tokante Hulanda Karibense tambe ta kompletamente orientá riba Hulanda Karibense, ku algun eksepshon (Hermans i Kösters, 2019). Pa e públiko den e parti oropeo di e Reino esaki tambe ta nifiká ku den prensa ta skibi relativamente tiki tokante desaroyonan estadístiko den e paisnan CAS. P’esei, na okashon di e di diessinku aniversario di e sistema gubernamental aktual a disidí pa tòg bolbe duna atenshon na e seis islanan ku originalmente tabata forma Antia Hulandes. E artíkulo aki ta e resultado di esei. Sentral den esaki ta e pregunta kon ta pará ku e seis islanan aki kaminda ta trata di asuntunan manera poblashon, lenga, partisipashon laboral i prosperidat. I: kon nan a desaroyá nan mes den e diessinku añanan ku ta tras di lomba?
E sifranan ku a usa pa e paisnan CAS ta prosedente di e ofisinanan di statistik ariba menshoná. A resultá ku no tur sifra ta disponibel pa tur isla. Tambe tin diferensianan tin biaha den métodonan usá i den e aña di e informe. No a hasi intento pa kuantifiká e efekto di métodonan diferente. No a hasi análisis pa haña e kousa di diferensianan den desaroyo, pero sí ta sita deklarashonnan for di e literatura aki aya. Loke ta sobra ta un bista di e diferensianan (i e semehansanan) entre e islanan, ku un reserva chikí pa loke ta konserní kon komparabel e sifranan duná ta. E artíkulo ta dirigí su mes na tur hende ku ke profundisá su mes den e seis islanan a base di e datonan sosial-ekonómiko prinsipal.
Kapítulo 2 ta deskribí e fuentenan di dato i e método di investigashon ku a usa. Kapítulo 3 ta tokante e kantidat di habitante di e seis islanan i kon esaki a desaroyá su mes den e diessinku añanan ku ta tras di lombe. Tambe ta trata di e komposishon di e poblashon, e lenganan ku ta papia i e religion di e habitantenan. Kapítulo 4 ta trata di partisipashon laboral i e nivel di enseñansa. Kapítulo 5 ta para ketu serka e ekonomia. Kon grandi e ekonomianan ta, kon nan a desaroyá nan mes i kon nan komposishon ta? Den e kapítulo aki tambe ta trata ku inflashon den e parti karibense di e Reino Hulandes. E último kapítulo, e konklushon, ta trata tur e resultadonan di mas importante.
2. Dato i método
Komo ku por lo ménos kuater diferente fuente a wòrdu usá pa tur e sifranan den Kapítulo 2, 3 i 4, Sekshon 2.1 ta mustra e fuente di e informashon. E sifranan mes ta indiká e periodo i/òf e fecha di referensia di e datonan. Datonan anual hopi bia no ta disponibel pa e paisnan di CAS. P’esei, pa vários indikadó, nos a skohe pa mustra solamente e status na 2025 i e status na 2011 (òf un otro aña disponibel rònt di e tempu di e transishon konstitushonal). Pa datonan unda e sifranan anual aki ta disponibel, nan ta wòrdu mustrá.
2.1 Fuente
Fuentenan usá pa kada indikadó
| Indikadó | Fuente |
| Tamaño di poblashon i desaroyo di poblashon | Caribisch Nederland; bevolking (Hulanda Karibense; poblashon) Curaçao, bevolking (Kòrsou, poblashon) DBSB 30 di yüni 2025 | Aruba, bevolking Sint Maarten, bevolking (Aruba, poblashon) (Sint Maarten, poblashon) (Senso 2022 & Senso 2011) |
| Sekso i edat | Caribisch Nederland, geslacht en leeftijd (Hulanda Karibense, sekso i edat) Curaçao, geslacht en leeftijd (Kòrsou, sekso i edat) DBSB 30 di yüni 2025 | Aruba, geslacht en leeftijd (Aruba, sekso i edat) (Senso 2022 & Senso 2011) |
| Pais natal | Caribisch Nederland, geboorteland (Hulanda Karibense, pais natal) No ta konosí DBSB 30 di yüni 2025 | Aruba, geboorteland Sint Maarten, geboorteland (Aruba, pais natal Sint Maarten, pais natal) (Senso 2022 & Senso 2011) |
| Estado sivil | Caribisch Nederland, burgerlijke staat (Hulanda Karibense, estado sivil) Demographic characteristics | Senso Kòrsou (Karakteristikanan demografiko | Senso Kòrsou (Senso 2023 & Senso 2011) DBSB 30 di yüni 2025 | Aruba, huwelijkse staat (Aruba, estado sivil) Sint Maarten, huwelijkse staat (Sint Maarten, estado sivil) (Senso 2011) |
| Lenganan | Caribisch Nederland, talen (Hulanda Karibense, lenganan) i Omnibusenquête (Enkuesta Omnibus) Curaçao, talen (Korsou, lenganan) i Curaçao, talen (Korsou, lenganan) No ta konosí Sint Maarten, talen (Sint Maarten, lenganan) (Senso 2022) |
| Religion | Caribisch Nederland, kerkelijke gezindte (Hulanda Karibense, religion) Curaçao, kerkelijke gezindte (Kòrsou, religion) DBSB 30 di yüni 2025 | Aruba, geboorteland (Aruba, pais natal) Sint Maarten, kerkelijke gezindte (Sint Maarten, religion) (Senso 2022 & Senso 2011) |
| Partisipashon laboral neto | Caribisch Nederland, netto-arbeidsparticipatie (Hulanda Karibense, partisipashon laboral neto) Curaçao, netto-arbeidsparticipatie (Kòrsou, partisipashon laboral neto) Aruba, netto-arbeidsparticipatie (Aruba, partisipashon laboral neto) i Curaçao, netto-arbeidsparticipatie (Kòrsou, partisipashon laboral neto) Sint Maarten, netto-arbeidsparticipatie (Sint Maarten, partisipashon laboral neto) |
| Desempleo | Caribisch Nederland, werkloosheid (Hulanda Karibense, desempleo) Curaçao, werkloosheid (Kòrsou, desempleo) i Curaçao, werkloosheid (Kòrsou, desempleo) Aruba, werkloosheid (Aruba, desempleo) Sint Maarten, werkloosheid (Sint Maarten, desempleo) i Sint Maarten, werkloosheid (Sint Maarten, desempleo) (Senso 2022) |
| Nivel di enseñansa | Caribisch Nederland, hoogst behaald onderwijsniveau (Hulanda Karibense, nivel di enseñansa di mas haltu alkansá) Curaçao, onderwijsniveau (Kòrsou, nivel di enseñansa) Aruba, onderwijsniveau (Aruba, nivel di enseñansa) No ta konosí |
| bbp i desaroyo di bbp | Caribisch Nederland, bruto binnenlands product (bbp) (Hulanda Karibense, produkto interno bruto (bbp)) Curaçao, bruto binnenlands product (bbp) Kòrsou, produkto interno bruto (bbp)) Aruba, bruto binnenlands product (bbp) (Aruba, produkto interno bruto (bbp)) Sint Maarten, bruto binnenlands product (bbp) (Sint Maarten, produkto interno bruto (bbp)) |
| Balor agregá bruto pa ramo di empresa | Caribisch Nederland, bruto toegevoegde waarde per bedrijfstak (Hulanda Karibense, balor agregá bruto pa ramo di empresa) No ta konosí Curaçao, bruto toegevoegde waarde per bedrijfstak (Kòrsou, balor agregá bruto pa ramo di empresa) Aruba, bruto toegevoegde waarde per bedrijfstak (Aruba, balor agregá bruto pa ramo di empresa) Sint Maarten, bruto toegevoegde waarde per bedrijfstak (Sint Maarten, balor agregá bruto pa ramo di empresa) |
| Turismo | Bonaire, toerisme (Boneiru, turismo) No ta konosí Curaçao, toerisme (Kòrsou, turismo) Aruba, toerisme (Aruba, turismo) Sint Maarten, toerisme (Sint Maarten, turismo) |
| Inflashon | Caribisch Nederland, consumentenprijsindex (CPI) (Hulanda Karibense, índise di preis pa konsumidó (CPI)) Curaçao, consumentenprijsindex (CPI) (Korsou, índise di preis pa konsumidó (CPI)) Aruba, consumentenprijsindex (CPI) (Aruba, índise di preis pa konsumidó (CPI)) Sint Maarten, consumentenprijsindex (CPI) (Sint Maarten, índise di preis pa konsumidó (CPI)) |
3. Poblashon
E kapítulo aki ta tokante poblashon di e parti karibense di Reino Hulandes. Promé lo trata ku e kantidat di habitante i desaroyo di esaki den e diessinku añanan ku ta tras di lomba. Despues lo trata ku komposishon di e poblashon. Tambe ainda lo trata ku e lenganan ku ta papia i ku e religion. Ora tin un desaroyo kla den e diessinku añanan despues di e reforma estatal tambe ta mustra e sifranan di 2010 òf 2011, si nan ta disponibel.
3.1. Tamaño di poblashon
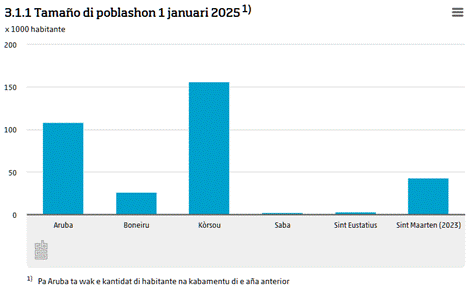
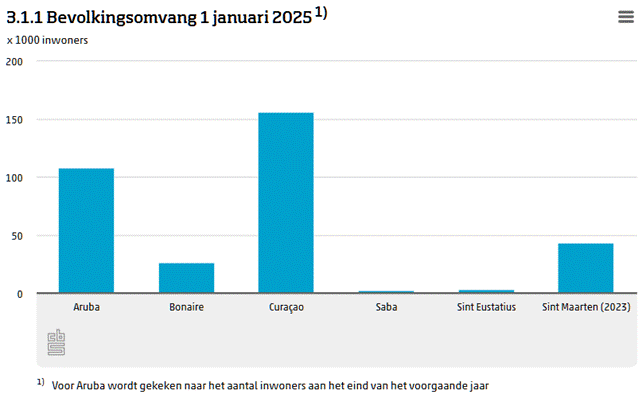
Na 2025, na tur tabatin mas o ménos 340 mil persona ta biba den e parti karibense di Reino Hulandes (figura 3.1.1). Esaki ta un tiki ménos ku e kantidat di habitante di e siudat Utrecht. Di e paisnan CAS, Kòrsou tin e kantidat di habitante di mas haltu; na 2025 tabata un tiki mas ku 156 mil. E kantidat di habitante na Aruba ta un tiki mas ku dos tersera parti di e kantidat di habitante di Kòrsou, esta mas ku 108 mil. Sint Maarten (teritorio Hulandes) na 2023 tabatin un tiki ménos ku 43 mil habitante. Esaki ta mas ku e kantidat total di habitante di Hulanda Karibense.
Di e islanan BES, e kantidat di habitante na Boneiru ta mas haltu. Riba promé di yanüari 2025, aki tabatin mas ku 26 mil persona ta biba. Na Sint Eustatius na kuminsamentu di 2025 tabatin algu mas ku 3 mil habitante i na Saba algu mas ku 2 mil. E echo ku e tres islanan ku e kantidat di mas grandi di habitante tambe tin mas outonomia no ta un kasualidat: esaki a hunga un ròl durante e reforma estatal. E kantidat di habitante di Sint Maarten di promé ku aña 2013 i despues di aña 2023 no ta disponibel; p’esei ta mustra e kantidat di habitante di aña 2023 komo e sifra di mas resien.
Desaroyo tamaño di poblashon
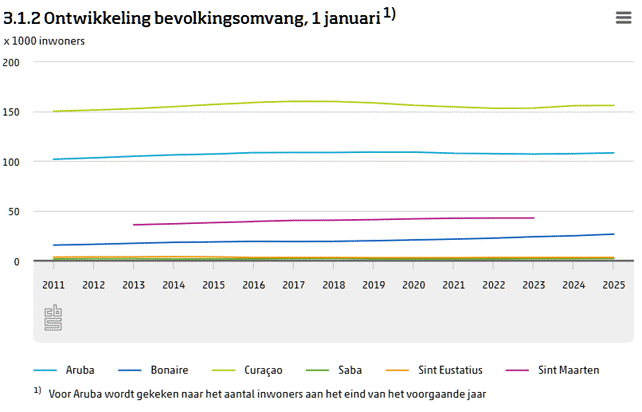
Figura 3.1.2 ta demostrá ku e kantidat di habitante di mayoria isla a krese levemente den e diessinku añanan ku ta tras di lomba; solamente na Sint Eustatius e kantidat di habitante aktualmente ta un tiki mas abou ku na 2011. E bahada tin hopi di haber ku un limpiesa atministrativo. Si e poblashon en realidat a baha òf asta a subi, ya no ta posibel pa haña sa mas. Boneiru ta forma un eksepshon di un otro manera: e kantidat di habitante di e isla aki a krese relativamente lihé den e periodo aki. Na 2011 ainda tabatin un tiki mas ku 15 mil persona ta biba einan i na 2025 tabatin 26,6 mil; un oumento di kasi 70 porshento. E oumento ta visibel serka tur kategoria di edat, pero ta remarkabel ku e tamaño di e gruponan di habitante di 60 aña i mas a bira (mas ku) dòbel kompará ku 2011. Wak figura 3.2.2 tambe p’esaki. E oumento di habitante na Boneiru pa gran parti ta kousá dor di e echo ku tabatin mas hende ku a bin wonen na e isla ku hende ku a bai.
————————————————————————————————————————————–
Den e figura akibou ta mustra desaroyo di tamaño di poblashon di e seis islanan. Komo ku e kantidat di habitante di Kòrsou ta konsiderablemente mas grandi ku por ehèmpel Sint Eustatius i Saba, e desaroyo di e último dos islanan aki ta ménos fásil pa mira. Si bo klek den e leyenda abou den e figura riba un isla spesífiko bo por eliminá esaki. Por ehèmpel: ora klek riba Kòrsou abou den e figura, no ta mustra esaki. Di e manera aki ta posibel pa selekshoná e islanan di bo eskoho i asina por mira desaroyo di e islanan chikí mas mihó.
————————————————————————————————————————————–
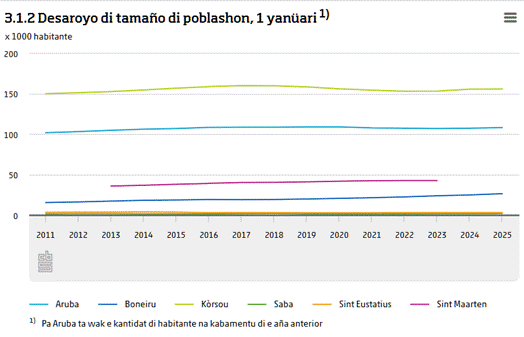
Na tur, e kantidat di habitante di e parti karibense di Reino Hulandes a krese den e diessinku añanan ei ku un tiki ménos ku 10 porshento, di mas o ménos 317 mil habitante na 2011 pa 340 mil habitante na 2025.
3.2. Komposishon di poblashon
Sekso
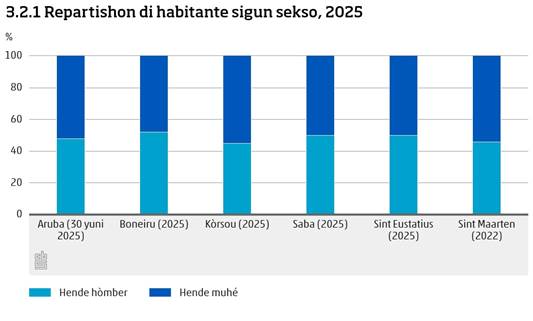
Den figura 3.2.1 por mira ku pa Sint Eustatius i Saba e proporshon entre e kantidat di hende hòmber i hende muhé ta eksaktamente igual na 2025. Na Kòrsou i Aruba tin un tiki mas hende muhé ku hende hòmber ta biba (55 versus 52 porshento). Na Boneiru i Sint Maarten ta kontrali. Den e diessinku añanan ku ta tras di lomba, e bista aki no a kambia masha. Na 2011 e porsentahe di hende hòmber pa e islanan BES tabata solamente un porshento mas haltu ku na 2025.
Edat
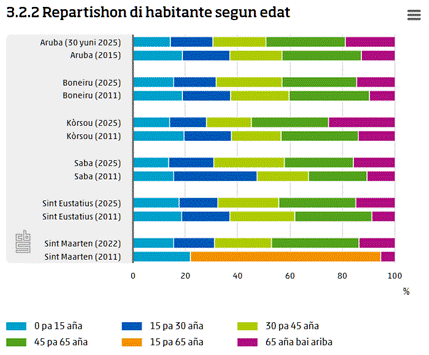
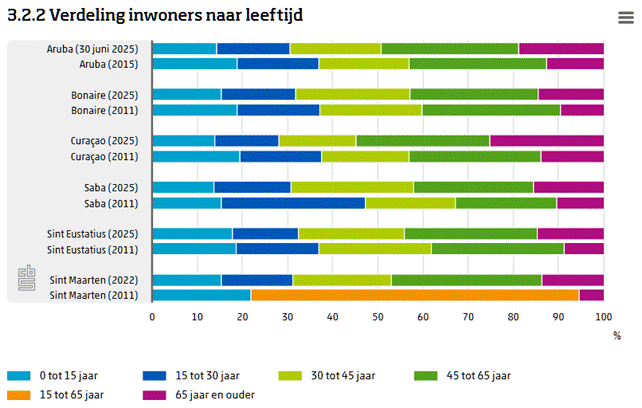
Kòrsou (i te na un grado mas abou Aruba tambe) tin un kantidat relativamente grandi di habitante di edat avansá. Figura 3.2.2 ta demostrá ku un kuarta parti di e habitantenan ei tin sesentisinku aña òf mas. Pa e islanan BES, e kantidat di senior hustamente ta hopi mas abou; einan, rondó di diessinku porshento di e poblashon tin sesentisinku aña òf mas. Tur e islanan a embehesé fuertemente den e último dies pa diessinku añanan. Partikularmente na Kòrsou, e proseso a bai rápidamente. Na 2015 (e sifranan pa aña 2011 no ta konosí) solamente 13,8 porshento di e poblashon tabatin sesentisinku aña òf mas; na 2025, manera a bisa kaba, un tiki mas ku un kuarta parti. Na 2011, na e islanan BES solamente mas o ménos 10 porshento di e poblashon tabatin mas ku sesentisinku aña. No a investigá e grado na kua migrashon tambe ta hunga un ròl den e envehesimentu di e poblashon.
Pais natal
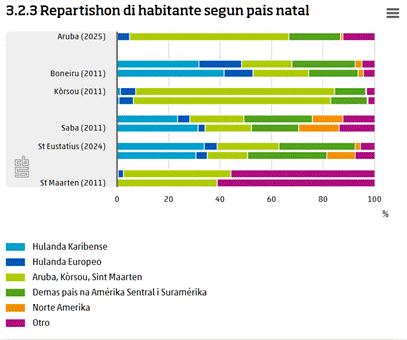
Tin diferensianan grandi den e paisnan natal di e habitantenan di e seis islanan (wak figura 3.2.3). No tur fuente konosé e mesun repartishon. Por ehèmpel: den e fuente pa Sint Maarten (2022) no ta hasi un partishon entre Nortamérika i Suramérika. P’esei esakinan ta kai bou di e kategoria ‘demas’. Pa 2011, hustamente tabatin solamente un partishon entre ‘e Antia Hulandes di ántes i Aruba’ i sobrá optenibel. Pa Aruba ta konta atrobe ku pa paisnan ku ménos ku 250 persona nasi den e pais ei tabata kai bou di e grupo ‘demas’ den e fuente. Dor di esaki, ta posibel ku a duna un bista di e porsentahe di habitante di Aruba ku a nase na un di e islanan BES ku un sifra mas abou ku e kantidat real. Pa 2011 no tabatin sifranan disponibel.
Pa Boneiru, Sint Eustatius i Saba ta konta ku na 2024 (e aña di informe di mas resien) ta solamente mas o ménos un tersera parti di e habitantenan tambe a nase den e área di BES. Un kuarta parti ta bini for di demas pais na Suramérika i Amérika Sentral, i un otro kuarta parti for di un di e paisnan CAS. Pa Aruba, hustamente ta remarkabel ku mayoria di e habitantenan tambe a nase na e paisnan CAS. Pa Boneiru ta konta ku 17 porshento a nase na Hulanda Oropeo. E porsentahe aki ta bastante mas haltu ku serka e otro islanan.
Ora hasi komparashon ku komposishon di e poblashon na 2011 ta remarkabel ku na Boneiru i Saba e porsentahe di habitante ku a nase na Hulanda Karibense a baha: di respektivamente 41,7 porshento pa 31,9 porshento i di 31,7 porshento pa 23,7 porshento. Pa Boneiru ta konta ku tantu e parti di persona nasi na Hulanda Oropeo komo e parti di persona nasi na Amérika Sentral i Suramérika a krese, pa Saba e motibu prinsipalmente ta un oumento di e último grupo aki. Na Sint Eustatius e parti di habitante nasí na Hulanda Karibense hustamente a krese un un tiki (3,2 porshento) kompará ku 2011.
Estado sivil
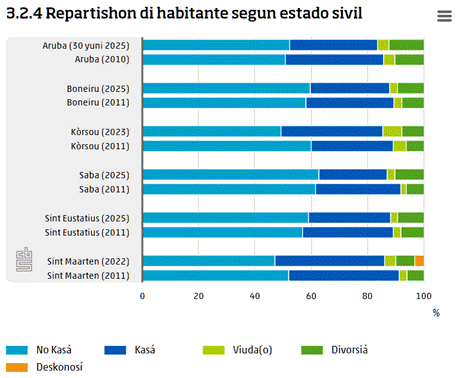
Pa e estado sivil di e habitantenan, a repartí e posibilidatnan den kuater kategoria; ‘kasá’, ‘no kasá’, ‘divorsiá’ i ‘viuda/o’. Den e kasonan kaminda e fuente tabatin un kategoria ‘partner registrá’ a klasifiká esaki serka e kategoria ‘kasá’. Den e figura 3.2.4 por mira ku, maske na Kòrsou i Aruba tantu e porsentahe di habitante kasá komo e porsentahe di habitante divorsiá ta un tiki mas haltu ku na e islanan BES, e repartishon na 2025 den su totalidat ta komparabel pa e sinku islanan pa kua tin datonan disponibel. Pa e islanan BES ta konta ku e parti di habitantenan kasá a baha den transkurso di tempu. Na Kòrsou e parti ei hustamente a krese un un tiki. Pa tur e islanan si por mira un oumento pa loke ta e parti di habitante divorsiá.
3.3 Lenganan
Den e parti karibense di e Reino Hulandes ta papia diferente lenga. Pa kada isla ta diferente kiko ta e lenganan ofisial i kiko ta e lenganan ku ta papia. En general, e lenganan ofisial na e tres Islanan Ariba ta ingles i na e tres Islanan Abou ta papiamentu. Di e papiamentu ta eksistí dos grupo prinsipal: na Aruba ta papia papiamento, na Boneiru i Kòrsou Papiamentu. Papiamento tin un ortografia orientá riba etimologia, miéntras ku papiamentu tin un ortografia fonétiko. Papiamentu ta un lenga úniko ku a surgi for di un meskla di diferente lenga, inkluso portugues, spañó, hulandes, ingles i diferente lenga afrikano.
Lenganan ofisial i lenganan ku ta papia
Na Kòrsou e lenganan ofisial ta ingles, hulandes i papiamentu. Na Aruba hulandes i papiamento ta e lenganan ofisial. Na Sint Maarten ta ingles i hulandes. Na e islanan BES hulandes ta e lenga ofisial. Banda di hulandes, tambe a rekonosé papiamentu i ingles komo lenganan ofisial. Esei ta enserá ku ta permití pa usa e lenganan aki den enseñansa, den e kontakto ku gobièrnu i den hurisdikshon.
E diversidat di lenganan tambe ta bin bek ora ta wak e lenganan ku ta papia na e islanan. Na e islanan BES, den e Omnibusenquête (enkuesta Omnibus) di 2021, CBS a puntra e hendenan kua lenga òf kua lenganan nan ta papia. Serka e pregunta aki tabatin vários posibel kontesta (papiamentu, ingles, hulandes, spañó i Un otro lenga). Ora e respondente tabata papia mas ku un lenga, tabata puntra kua ta e lenga mas papia. Pasobra e sifranan aki ta basa riba investigashon arbitrario, tin márgennan riba e sifranan aki. Den e figura 3.3.1 a duna un bista di e resultadonan di esaki.
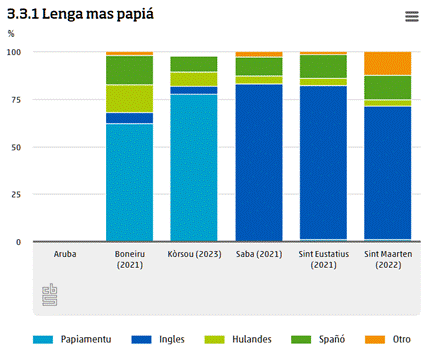
Na Sint Eustatius, Saba i Sint Maarten ta papia prinsipalmente ingles. Na Sint Maarten, pa mas o ménos 70 porshento di e respondentenan e ta e lenga di uso prinsipal, na Sint Eustatius i Saba pa mas ku 80 porshento. Na Curaçao (Kòrsou), Papiamentu ta e lenga prinsipal pa kasi 80 porshento di e poblashon, na Boneiru esaki ta konta pa algu mas ku 60 porshento. Na Boneiru, e lenga ku ta papia mas ta esun ménos dominante.
Koherensia entre ubikashon di e islanan i e lenga ofisial
Tradishonalmente, e islanan den e parti karibense di Reino Hulandes tabata repartí den ‘Islanan Abou’ i ‘Islanan Ariba’. E Islanan Abou, tambe yamá e islanan ABC, ta Aruba, Boneiru i Kòrsou. E islanan Ariba, tambe yama e islanan SSS, ta Sint Maarten, Sint Eustatius i Saba. E términonan ta referí na nan ubikashon respekto di e bientunan di pasat. E Islanan Abou ta situá dilanti di kosta di e pais Suramerikano Venezuela. E Islanan Ariba ta situá mas ku 800 kilometer den direkshon nort den Laman di Karibe. E sifranan den figura 3.3.1 ta demostrá un koherensia kla entre e lenga ofisial i e ubikashon di e islanan. Na e Islanan Abou (Boneiru i Kòrsou), papiamentu ta un lenga dominante i na e Islanan Ariba (Sint Maarten, Sint Eustatius i Saba) ta ingles.
Vários lenga
Banda di e lenga ofisial, tambe tin informashon tokante kua ta e lenganan ku e habitantenan di e islanan sigur ta papia. Na Boneiru, mas ku 90 porshento di e habitantenan ta papia mas ku un lenga. E investigashon a demostrá ku, ounke ku papiamentu ta e lenga ofisial, mas ku tres kuarta parti di e hendenan na Boneiru ta papia ingles i hulandes tambe. Na Sint Eustatius i Saba, pa mas ku mitar di e poblashon ta konta ku nan ta papia mas ku un lenga (CBS, 2022a). Aki nan ta papia ménos papiamentu, pero mas o ménos un tersera parti di e poblashon papiá ta papia hulandes i spañó (CBS, 2022b).
3.4 Religion
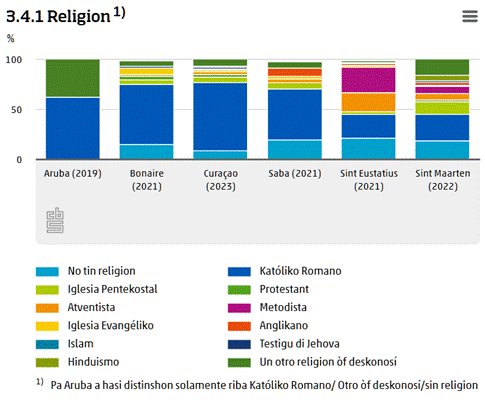
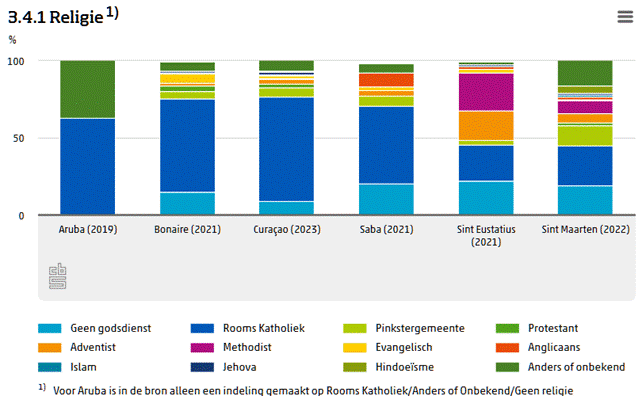
E parti di mas grandi di e poblashon di Hulanda Karibense, Kòrsou i Aruba ta konsiderá su mes parti di un grupo religioso. Na Sint Eustatius i Saba e habitantenan mas tantu ta indiká ku nan no tin un religion (respektivamente 22,1 i 20,4 porshento). Pa tur e islanan ta konta ku katolisismo ta e religion muchu mas grandi di tur. Na e islanan mas grandi, e parti katóliko ta mas ku 60 porshento. No ta parse ku tabatin kambionan masha grandi kompará ku 2011, eksepto ku riba tur e islanan, na 2025 (te kon leu ta konosí) un parti mas grandi di e poblashon a indiká ku nan no tin un religion.
4. Labor i enseñansa
Den e kapítulo lo trata ku e merkado laboral na Karibe Hulandes. Lo wak kuantu hende tin trabou i kon haltu e desempleo ta, i kon esaki a kambia den transkurso di tempu. Tambe lo trata ku nivel di edukashon di e habitantenan.
4.1. Partisipashon laboral i desempleo
Serka sifranan tokante e merkado laboral, hopi biaha ta repartí e poblashon den tres grupo:
- E poblashon aktivo ku tin trabou. E ta konsistí di personanan ku tin trabou pagá.
- E poblashon aktivo sin trabou. Esnan ku no tin trabou pagá, pero sí resientemente a buska trabou pagá i ku ta direktamente disponibel pa esei.
- E poblashon no aktivo. Esaki ta konsistí di personanan sin trabou pagá ku no a buska trabou resientemente òf no ta direktamente disponibel pa esei. Algun motibu pa esaki por ehèmpel por ta inkapasidat pa traha i kuido di hendenan yegá.
Hende ku trabou i hende sin trabou huntu ta forma e poblashon aktivo. Na e islanan BES, ta usual pa limitá e edat di e tres gruponan na 15 pa 75 aña. Na e paisnan CAS, no ta tene nan mes na e límite ariba. No ta inkluí e poblashon institushonal (CBS,2022), habitantenan di por ehèmpel kas di kuido òf prizòn. No ta kla si ta inkluí e grupo aki na e paisnan CAS.
Partisipashon laboral neto
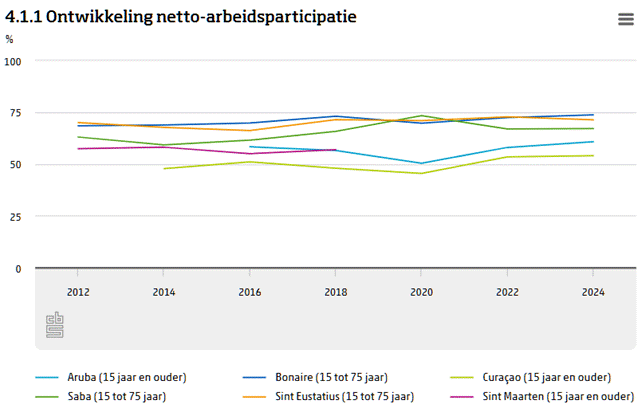
E nòmber pa e porsentahe di e poblashon ku trabou pagá ta partisipashon laboral neto. Esaki ta e parti di e poblashon aktivo kompará ku e poblashon total (tantu e poblashon aktivo komo esun inaktivo). Den figura 4.1.1 a duna un bista di e partisipashon laboral neto pa e seis islanan pa e periodo 2012 te ku 2024. Mester remarká ku den e kapítulo aki no por papia di un desaroyo kontinuo, komo ku na Hulanda Karibense no ta hasi e AKO (Enkuesta di forsa laboral) kada aña, sino kada dos aña. Pa Sint Maarten ta konta ku no tin e mesun añanan disponibel ku pa e otro islanan. P’esei den e figura, 2012 en realidat ta 2011, 2014 den e figura ta 2013 i 2016 den e figura ta 2017.
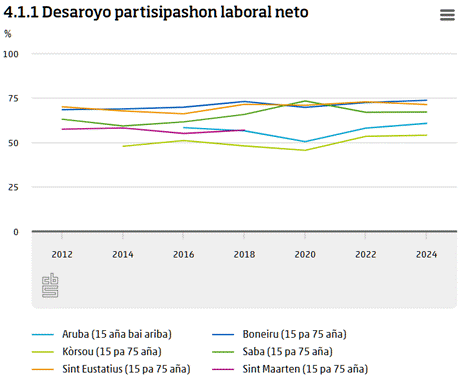
Riba tur e seis islanan, e mayoria di e poblashon tin trabou pagá. Por tin vários motibu pakiko personanan no por òf no ke traha. Na Boneiru i Sint Eustatius, e partisipashon laboral neto den e delaster añanan tabata mas ku 70 porshento. Na Saba e tabata un tiki mas abou, esta 67 porshento. Esaki ta pasobra tin un universidat grandi na e isla aki, di moda ku un parti di e habitantenan no ta parti di e poblashon aktivo (e studiantenan). E partisipashon laboral pa Aruba i Kòrsou strukturalmente ta mas abou ku esun di e islanan BES. Si no tabata konta hende di 75 aña bai ariba, partisipashon laboral na e paisnan CAS lo tabata mas haltu. E partisipashon laboral pa tur e islanan tabata basta konstante durante e periodo di investigashon.
Desempleo
Un otro indikadó ekonómiko importante ta e porsentahe di desempleo. Pa esaki ta wak e poblashon aktivo ku no tin trabou. Den figura 4.1.2 a duna un bista di desaroyo di e porsentahe di desempleo pa e seis islanan. Aki tambe ta konta ku pa Sint Maarten no tin e mesun añanan disponibel ku pa e otro islanan. P’esei den e figura, 2012 en realidat ta 2011, 2014 den e figura ta 2013 i 2016 den e figura ta 2017.
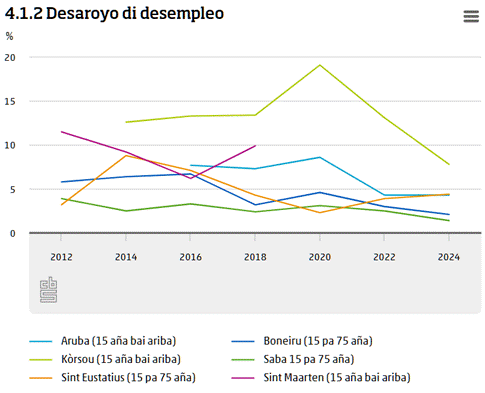
Na Kòrsou e desempleo ta esun di mas haltu den henter e periodo di investigashon. Sin embargo, si no tabata konta hende di 75 aña bai ariba, e desempleo na e paisnan CAS lo tabata mas abou. Den investigashon anterior ta menshoná vários motibu pakiko e desempleo riba e isla aki ta relativamente haltu. Algun ehèmpel di esaki ta e funshonamentu general di e ekonomia na Kòrsou, e dependensia fuerte di un kantidat limitá di ramo di empresa (falta di diversifikashon) i funshonamentu di e merkado laboral (por ehèmpel strobashonnan burokrátiko i un prosedura di pèrmit slo). Pa mas informashon tokante e merkado laboral na Kòrsou por fabor konsultá arbeidsmarkt Curaçao 2023 (merkado laboral Kòrsou 2023, CBS Curaçao, 2023b). Desempleo na e isla aki, ku eksepshon di e punto kulminante durante korona, a baha sí kompará ku 2016. Den e aña ei e porsentahe di desempleo ainda tabata mas ku 13 porshento, na 2024 esaki a baha bira ménos ku 8 porshento.
Na Aruba i Boneiru tambe desempleo a baha den e añanan ku ta tras di lomba. Na Aruba el a bai di mas ku shete porshento na 2016 pa un un tiki mas ku 4 porshento na 2024 i na Boneiru el a bai di mas ku 6 porshento na 2016 pa mas o ménos 2 porshento na 2024. Na Saba e desempleo ta esun di mas abou, den práktikamente tur e añanan. Na 2024 e desempleo na e isla aki tabata ménos ku dos porshento. Den investigashonnan anterior ku CBS a ehekutá e desempleo na Saba tambe tabata esun di mas abou (Hermans en Kösters, 2019). E desempleo na Sint Eustatius ta subi baha un tiki. E ekonomia na e isla aki ta hopi influensiá pa algun empresa grandi. E empresanan aki ta produsí prinsipalmente pa eksportashon i ta dependé di desaroyonan regional den e sektor di petroli.
Komo ku tur e islanan ta destinashonnan di fakansi popular, e sektornan di turismo, komèrsio i horeka ta e ramonan di empresa ku ta sòru pa mas tantu empleo. Sin embargo, kada isla ta karakterisá pa un struktura di sektor diferente. A skibi mas tokante esaki den kapítulo sinku.
4.2 Nivel di enseñansa
Den e paragraf aki lo wak e nivel di enseñansa di mas haltu alkansá pa e habitantenan di e seis islanan. Den figura 4.2.1 a duna un bista di e nivel di mas haltu ku a alkansá pa e islanan pa kua tabatin informashon disponibel. E informashon ta tokante 2016 i tokante e último aña disponibel: 2024. E nivel di enseñansa ta repartí den tres kategoria: ‘enseñansa básiko/vmbo òf mbo1’ komo edukashon di mas haltu ku a alkansá, ‘havo/vwo òf mbo 2-4’ komo edukashon di mas haltu ku a alkansá i ‘hbo òf wo’ komo edukashon di mas haltu ku a alkansá.
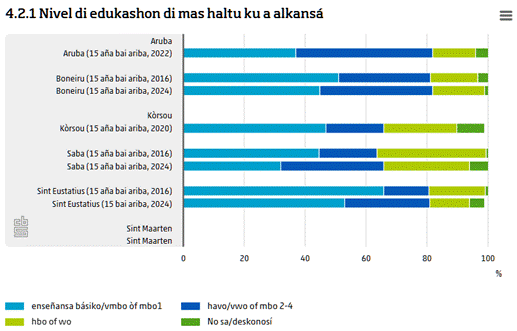
Mayoria habitante di e islanan tin ‘enseñansa básiko/vmbo òf mbo1’ komo edukashon di mas haltu ku a alkansá. Na e islanan Boneiru, Sint Eustatius i Kòrsou ta trata di 30 pa 50 porshento di e poblashon. Mas o ménos 15 pa 25 porshento di e habitantenan ta disponé di un diploma hbo òf wo. Saba ta duna un otro bista: e porsentahe di habitante ku un edukashon hbo òf wo aki ta relativamente haltu, esta mas ku un kuarta parti. E motibu pa esaki ta e universidat médiko grandi ku ta situá na e isla aki. Komo ku den e fuente a rònt af e porsentahenan, no tur pais ta konta te yega 100 porshento. Dor di esei, e sifranan ta indikativo.
E nivel di edukashon di e islanan BES a kambia un tiki for di 2016. Un parti mas chikí awendia tin ‘enseñansa básiko/vmbo òf mbo1’ komo edukashon di mas haltu ku a alkansá. Pa e sobrá islanan sifranan mas bieu no ta konosí.
Un problema konosí ta ku hóbennan di e islanan den e parti karibense di e Reino Hulandes ta bai studia otro kaminda, por ehèmpel na Hulanda Oropeo, i ku despues di nan estudio nan no ta bai e isla bèk. Asina, estimashonnan ta mustra ku na Kòrsou kada aña sentenáres di hóbennan ta bai for di e isla pa studia otro kaminda i ku ta solamente mas o ménos sinku porshento di e hóbennan aki ta bin bèk despues di nan estudio. Tambe ta resultá for di e investigashon bou di studiante di mas resien na e islanan BES (Bokern en Fernandez Beiro, 2025), ku un parti grandi di e hóbennan a indiká ku nan ke bai for di e isla den futuro pa bai biba un otro kaminda. Na Boneiru tabata trata di 81 porshento di e hóbennan i na Saba i Sint Eustatius asta 91 porshento. Riba tur tres e islanan ‘sigui un edukashon òf estudio’ i ‘wak mas di mundu’ tabata e motibunan ku mas a menshoná pa esaki.
E konsekuensia di e hóbennan ku ta bai ta ku e nivel di estudio promedio di e habitantenan di e seis islanan ta relativamente abou. Komo komparashon: na Hulanda Oropeo (CBS,2025b), un tiki mas ku un kuarta parti di e personanan di 15 pa 75 aña tin ‘enseñansa básiko/vmbo òf mbo1’ komo nivel di enseñansa di mas haltu ku a alkansá, mas o ménos 41 porshento ‘havo/vwo òf mbo 2-4’ i kasi un tersera parti ‘hbo òf wo’. E baimentu sin bin bèk di hende ku edukashon hbo i wo por tin influensia riba e merkado laboral lokal i riba e ekonomianan di e islanan. Komposishon di e poblashonnan tambe lo por ta influensiá pa esaki, por ehèmpel komo ku mester atraé migrantenan pa yena e vakaturanan habrí.
5. Ekonomia i Turismo
Den e kapítulo aki lo trata ku e ekonomianan di e seis islanan. Kon grandi e ekonomianan ta i kon e kresementu ekonómiko tabata den e añanan ku a pasa? Kua ta e ramonan di empresa prinsipal di e diferente islanan? Finalmente lo trata ku inflashon.
5.1 Produkto interno bruto
Un midí hopi usá pa hasi e tamaño di e ekonomia visibel ta e produkto interno bruto (bbp). E bbp ta mas o ménos igual na loke ta produsí, gana òf gasta na un pais. Den e Midimentu base monitòr konteksto makroekonómiko Hulanda Karibense (CBS,2024) ta duna mas informashon tokante kon ta midi esaki. E bbp pa habitante ta para pa e prosperidat den un sentido mas estrikto. ‘Prosperidat amplio’ no ta bini dilanti den e artíkulo aki. Promé ku trata ku e bbp, lo diskutí e diferensianan di moneda.
Moneda
E islanan no tur tin e mesun moneda. E moneda ofisial na 2025 di Kòrsou i Sint Maarten ta e florin karibense. For di 31 di mart 2025, esaki ta sigui e florin hulandes antiano. E florin arubiano ta e moneda di Aruba. A introdusí esaki despues ku Aruba na 1986 a haña e status aparte den e Reino Hulandes (promé, aki tambe tabata usa e florin antiano). Na e islanan BES, for di promé di yanüari 2011 e dòler merikano ta e medio di pago legal. Turismo i komèrsio a hunga un ròl serka e eskoho pa e moneda. Pa por kompará e tamaño di e ekonomia entre e seis islanan, a kalkulá tur montante na dòler merikano.

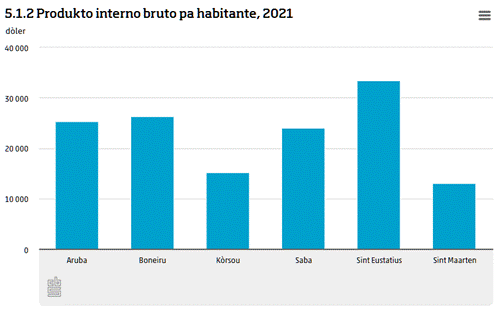
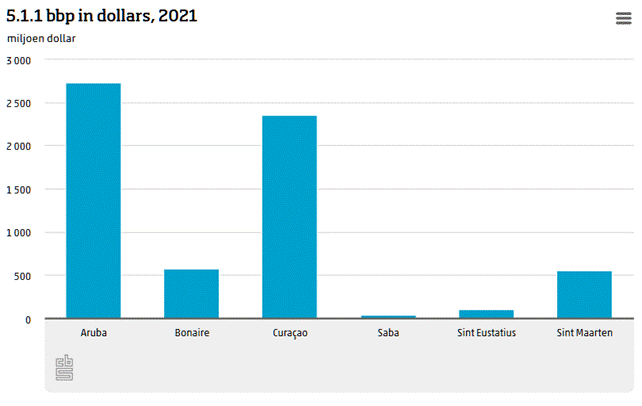
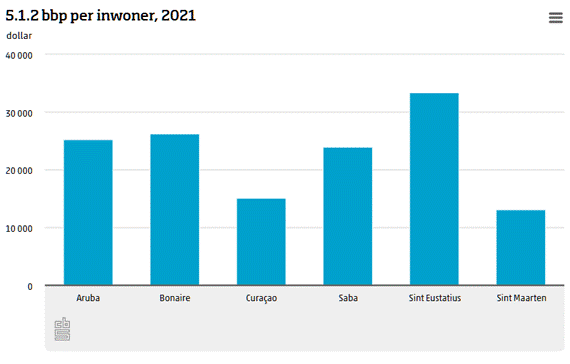
Manera figura 5.1.1 ta mustra, Aruba i Kòrsou ta e gigantenan ekonómiko; e sobrá ekonomianan ta bastante mas chikí. Esaki parsialmente ta reflehá e kantidat di habitante: mas habitante tin, mas tantu e hendenan ta produsí i konsumí. Sin embargo esei no ta e úniko faktor. Asina Aruba no tin e kantidat di habitante di mas haltu, pero sí e bbp di mas haltu.) Pa kompará e nivel di prosperidat entre e islanan, ta usual pa wak e bbp pa habitante. Manera por mira den Figura 5.1.2, esei ta muchu mas haltu ku tur na Sint Eustatius (sifranan 2021). Esun na Boneiru, Saba i Aruba ta bon komparabel. Na Kòrsou i Sint Maarten e ta bastante mas abou. No a koregí e sifranan pa diferensianan den forsa di kompra (pa e ekivalente di 1 dòler merikano riba esun isla bo por kumpra mas ku riba e otro).
5.2 Desaroyo di e bbp
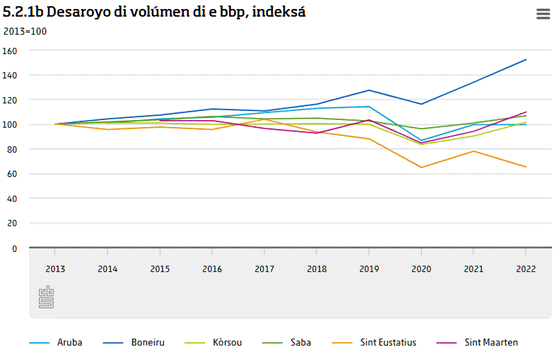
Figura 5.2.1a ta duna e desaroyo di volúmen di e bbp kompará ku e aña anterior, un midí pa desaroyo ekonómiko. Pa kasi tur e islanan, den mayoria aña por a papia di kresementu ekonómiko. Un eksepshon kla riba esaki ta e aña 2020: ora e ekonomia na tur seis isla a krem. Den e aña ei tabatin limitashonnan di biahe pa motibu di e pandemia di korona, ku tabatin un impakto grandi riba turismo. Despues di 2020 a sigui un rekuperashon fuerte sí, e aña siguiente. Remarkabel ta ku e ekonomia di espesialmente Sint Eustatius ta subi baha fuertemente. Esaki tin di haber ku e dependensia di e isla di algun empresa grandi. Esaki ta nifiká tambe ku e bbp pa habitante manera presentá den e paragraf anterior ta dependé fuertemente di e aña di komparashon skohé.

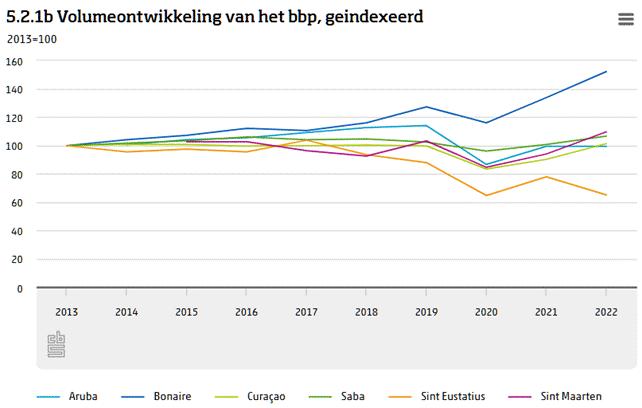
Pa haña mas komprondementu di e kresementu riba término mas largu, a indeksá desaroyo di volúmen di e bbp den figura 5.2.1b for di 2013. Pa Aruba i Sint Maarten falta e promé añanan den e serie. P’esei, pe e islanan aki e grafik ta kuminsá mas lat, riba e índise promedio di e otro islanan den e aña ei. Ta bira kla ku e bbp di Boneiru tabata esun ku a krese mas for di 2013, i ku esun di Sint Eustatius a krem. Riba e demas islanan e ekonomia tabatin un kresementu leve; e islanan no ta diferensiá hopi for di otro. Kompará ku Hulanda Oropeo, e kresementu for di 2013 tabata moderá: e bbp di Hulanda Oropeo na 2022 tabata kasi un kuarta parti mas haltu ku esun di 2013.
5.3 Balor agregá bruto pa ramo di empresa
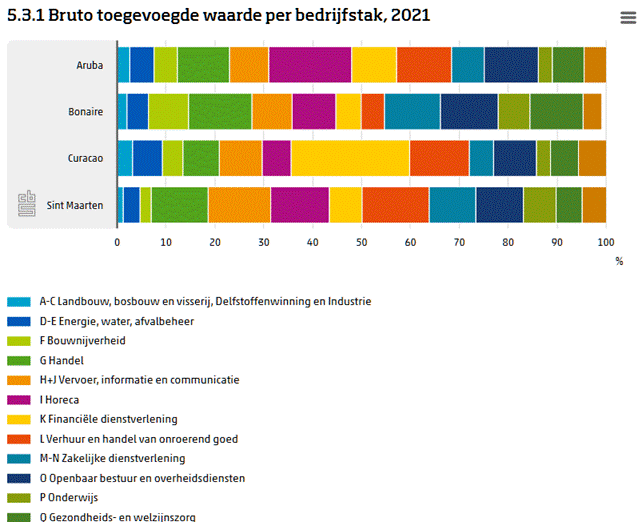
Pa e kuater islanan di mas grandi tambe tin informashon konosí tokante e balor agregá bruto pa ramo di empresa. Esaki ta duna komprondementu tokante kon e ekonomianan ta konstruí i por ehèmpel si nan ta dependé di un kantidat limitá di ramonan di empresa. Lo mustra e sifranan aki pa 2021, e aña di mas resien di kua e sifranan pa tur e kuater islanan mas grandi ta konosí. E informashon aki no ta disponibel pa Sint Eustatius i Saba pasobra CBS ta mará na regla di divulgashon. Dor di esaki no ta posibel pa publiká e sifranan di sierto ramonan di empresa na Sint Eustatius i Saba. E aña ku a mustra sinembargo tabata meimei di e periodo di korona i dor di esei por duna un bista distorshoná. Sifranan tokante e periodo inmediatamente despues di e reforma estatal no ta disponibel.

Manera figura 5.3.1 ta mustra, na Kòrsou e servisio finansiero ta hopi importante pa e ekonomia lokal. Aki ta trata di kasi un kuarta parti di e balor agregá di e isla. Den e ramo di empresa aki ta kai diferente banko, empresa di seguro i otro instituto finansiero. Pa tur kuater isla, e importansia di turismo ta bira kla. Asina, na Aruba horeka ta e ramo di empresa di mas importante. Tambe, komèrsio por ehèmpel riba tur e islanan ta un sektor relativamente grandi. Den esaki tambe ta kai komèrsio minorista, manera e pakusnan i merkadonan.
5.4 Turismo
Manera e paragraf anterior tambe a demostrá, turismo riba tur e islanan ekonómikamente mirá ta un di e ramonan di empresa di mas importante. Pa duna un imágen di e desaroyo i e proporshon di e kantidat di turista na e islanan, den figura 5.4.1 a duna un bista di e kantidat di pasahero di krusero pa e periodo 2011 te ku 2023. Pa Sint Eustatius i Saba no tin datonan disponibel. Pa hopi isla, barkunan krusero ta un fuente di entrada importante. Na promé lugá, e efekto destruktivo di e krísis di korona ta bira kla. Despues di tres aña malu e kantidat di pasahero na 2023 porfin a bolbe aserká e nivel di promé ku korona.

Sint Maarten ta konosé e kantidat di pasahero di krusero ku ta muchu mas grandi. P’esei pa Sint Maarten e bahada durante korona tambe tabata esun di mas severo. E kantidat di turista ku ta bin Boneiru riba barku krusero generalmente ta bastante mas abou ku pa e paisnan CAS.
5.5 Inflashon
Finalmente e kapítulo aki ta wak inflashon. Inflashon ta e subida promedio di preis di produkto di konsumo. Pa por midi e inflashon bon, promé mester hasi visibel na kiko e habitantenan di e islanan ta gasta nan sèn. Despues ta wak e kostonan di e biennan i servisionan ku e habitantenan ta kumpra. CBS ta hasi esaki pa Boneiru, Sint Eustatius i Saba via enkuestanan por eskrito, opservashonnan riba internet, registrashonnan eksterno, i enkuestadónan ku ta nota un parti di e preisnan dor di pasa na pakusnan. Den e Midimentu base di e monitòr konteksto makroekonómiko por haña mas informashon tokante kon CBS ta midi inflashon.
Komo ku e métodonan pa hasi inflashon visibel no ta uniforme, esaki por influensiá similaridat di e resultadonan. Diferensianan den e patronchi di gasta sèn di konsumidó tambe ta influensiá inflashon. Mester tene kuenta ku esaki ora di interpretá e sifranan akibou. E periodo ku e sifranan ta disponibel tambe ta varia hopi entre e islanan. Asina, pa Kòrsou tin sifranan konosí for di 1970 i pa Sint Maarten for di 2019 numa. Den figura 5.5.1 ta duna un bista indeksá di e inflashon for di e transishon estatal (2011). Pa Sint Maarten a tuma un índise pa e promé aña disponibel igual na e promedio di e otro islanan den e aña ei.
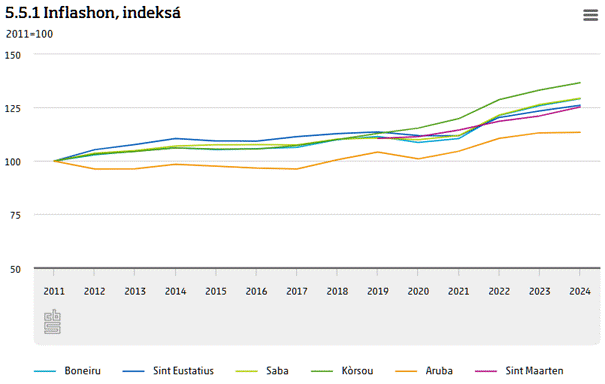
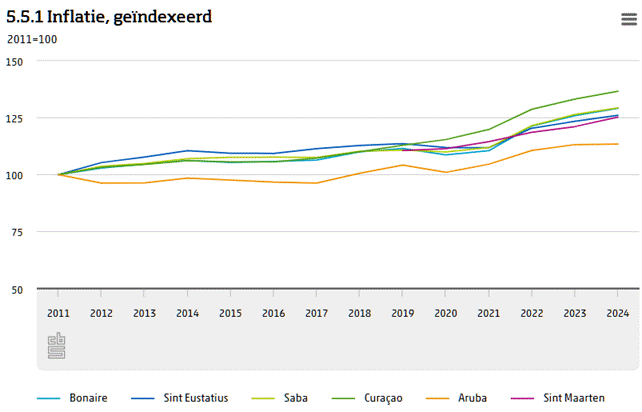
Manera figura 5.1.1 ta demostrá, preisnan a krese mas tantu na Kòrsou. Asina, aki na aña 2024 e preisnan tabata 36,6 porshento mas haltu ku na 2011. Esei ademas ta un un tiki mas abou ku Hulanda Oropeo, kaminda preisnan a subi ku 39 porshento. Aruba tabata e kaminda ku e preisnan a subi ménos ku tur; 13,4 porshento. Pa mayoria isla, e inflashon ta subi baha anualmente rondó di dos porshento, ku e aña 2022 klaramente komo aña ekstremo. Na tur e islanan den e parti karibense di e Reino Hulandes, e tempu ei e inflashon tabata hopi mas haltu: entre 3,6 porshento na Sint Maarten i 10 porshento na Boneiru. Inflashon tabata mas haltu rònt mundu. Por konsultá sifranan di inflashon pa otro paisnan via Banko Mundial. Kousanan frekuentemente menshoná di e punto kulminante aki pa loke ta inflashon rònt mundu ta e rekuperashon despues di e pandemia di COVID-19 i e invashon di Rusia na Ukrania.
Tambe den e promé añanan despues di e transishon estatal na 2010, e sifranan di inflashon ta relativamente haltu. Tabatin investigashon tokante e posibel kousanan di e subidanan di preis aki na Hulanda Karibense (Ecorys en Curconsult, 2017). Despues di e reforma a introdusí vários kambionan di sistema (impuestonan, duana, kuido, seguridat sosial) den un periodo relativamente korto. Kambionan semehante a trese insiguridat. Esaki, den kombinashon ku e kambio di e florin antiano pa e dòler merikano, a kousa un efekto di subida di preis. Ademas tambe tin kousanan makroekonómiko pa e subidanan di preis relativamente grandi den e periodo aki, manera preisnan haltu di petrolio i komestibel, tiponan di kambio di moneda ku ta subi baha i aparte di esei, tabatin intrankilidat den un pais di abastesementu importante: Venezuela.
6. Konklushon
Na tur, e kantidat di habitante di e parti karibense di Reino Hulandes despues di e transishon estatal a subi un tiki ménos ku 10 porshento bira 340 mil habitante na 2025. Pa gran parti, e kousa pa e subida aki ta un oumento di e poblashon na Boneiru: esaki a krese kasi 70 porshento (11 mil habitante) for di aña 2011. E kousa pa e oumento di habitante na Boneiru aki pa gran parti ta ku tabatin mas hende ku a bin biba na e isla ku hende ku a bai for di e isla.
E poblashon ta mas bieu ku diessinku aña pasá. Pa tur e islanan ta konta ku tin mas hende di riba sesentisinku aña bibá einan ku na aña 2011 òf den un aña komparabel. Kòrsou tin e oumento di senior di mas grandi; einan e kantidat di hende riba sesentisinku a krese di 15,3 porshento na 2015 pa 25,3 porshento na 2025.
Hopi habitante di e isla no ta prosedente di e islanan mes: pa Boneiru, Sint Eustatius i Saba ta konta ku un tersera parti di e habitantenan na aña 2024 tambe en realidat a nase den e área di BES. Pa Boneiru i Saba ta konta ku e parti di e habitantenan ku a nase na Hulanda Karibense a baha ku 10 i 8 porshento, respektivamente. Mas persona prosedente di Hulanda òf Amérika Sentral i Suramérika a bai biba einan. Na Aruba (62 porshento) i Sint Maarten (41,6 porshento) e parti di habitante ku a nase den e área di CAS ta muchu mas haltu.
Na tur e seis islanan, e gran mayoria di e poblashon tin trabou pagá. Sin embargo, e partisipashon laboral na e Paisnan CAS strukturalmente ta mas abou ku na e islanan BES, i e desempleo ta hustamente mas haltu. Sí ta asina ku desempleo a baha na tur e islanan den e añanan ku ta tras di lomba. Un problema konosí na e islanan ta ku hóbennan di e islanan den e parti karibense di e Reino ta bai studia otro kaminda, por ehèmpel na Hulanda Oropeo, i ku un parti di nan despues di nan estudio no ta bolbe na e isla. E konsekuensia di e hóbennan ku ta bai aki ta ku e nivel di edukashon promedio di e habitantenan di e seis islanan ta relativamente abou. Ora hende ku edukashon hbo i wo bai i keda sin bin bèk, esaki por tin un influensia riba e merkado laboral lokal i riba e ekonomianan di e islanan.
Ta mas ku bisto ku e bbp pa habitante di mas haltu ta na Sint Eustatius i esun di mas abou na Kòrsou i Sint Maarten. E bbp di e otro tres islanan ta komparabel. E ekonomia di Sint Eustatius for di 2013 sí ta esun ku a krese mas slo, esun di Boneiru ta esun ku a krese mas lihé. E isla kaminda for di aña 2011 preisnan a krese mas lihé ta Kòrsou i kaminda nan a krese mas slo ta Aruba.
Fuentenan
Bokern, Paul, en Linda Fernandez Beiro, 2024, Jongeren in Caribisch Nederland: resultaten Scholierenonderzoek CBS, 2020, Definitie institutionele bevolking
CBS, 2021, Omnibusenquête Caribisch Nederland
CBS, 2022a, Caribisch Nederland, spreekt meer dan één taal CBS, 2022b, Caribisch Nederland, gesproken talen
CBS, 2023, CBS meerjarenprogramma Caribisch Nederland 2024-2028
CBS, 2024, Nulmeting monitor macro-economische context Caribisch Nederland
CBS, 2025a, Caribisch Nederland; bevolkingsontwikkeling, geboorte, sterfte en migratie CBS, 2025b, Bevolking; hoogstbehaald onderwijsniveau en regio
CBS Curaçao, 2023a, Population by most spoken language at home CBS Curaçao, 2023b, Analy se van de arbeidsmarkt op Curaçao 2023 CBS Curaçao, 2023c, Educational attainment and Outcome in Curaçao
Ecorys en Curconsult, 2017, Onderzoek naar prijzen in Caribisch Nederland
Hermans, Brigitte en Lian Kösters, 2019, Beroepsbevolking op de Nederlands-Caribische eilanden Wereldbank, 2025, Inflation, consumer prices
FUENTE: RCN/LIVE99FM
NEDERLANDS:
DE NEDERLANDSE CARAÏBEN VIJFTIEN JAAR NA DE STAATSKUNDIGE HERVORMING
Naar aanleiding van de staatkundige hervorming van de Nederlandse Caraïben in 2010 worden de zes eilanden waaruit de Caraïben bestaan vergeleken. Thema’s die aan de orde komen zijn bevolking, arbeid, onderwijs, economie en toerisme. Naast de actuele situatie wordt gekeken naar de ontwikkeling over de jaren 2010-2025.
* De auteurs bedanken Sabrina de Regt voor haar medewerking aan het artikel.
** Dit artikel is ook beschikbaar in het Engels en in het Papiamentu.
1. Inleiding
Op 10 oktober 2010 heeft een staatskundige hervorming van het Koninkrijk der Nederlanden plaatsgevonden. Op deze datum werd het land de ‘Nederlandse Antillen’ ontbonden. De Nederlandse Antillen bestond op dat moment uit vijf eilanden: Curaçao, Sint Maarten, Bonaire, Sint-Eustatius en Saba. Aruba was eerder ook onderdeel van de Nederlandse Antillen, maar kreeg in 1986 de ‘status aparte’. Dit betekende dat zij een zelfstandig land werden, maar nog wel een onderdeel waren van het Koninkrijk der Nederlanden.
Vanaf de staatkundige transitie in 2010 bestaat het Koninkrijk der Nederlanden uit vier landen: Curaçao, Aruba, Sint Maarten en Nederland. De eerste groep landen wordt ook aangeduid met de afkorting CAS-landen. Het land Nederland bestaat uit een Europees gedeelte en uit een Caribisch deel. Caribisch Nederland bestaat uit de openbare lichamen Bonaire, Sint Eustatius en Saba. Voor deze drie eilanden wordt ook wel de term ‘bijzondere gemeenten’ en de afkorting BES-eilanden gebruikt. ‘Caribisch deel van het Koninkrijk der Nederlanden’, ook wel ‘Nederlandse Caraïben’ of ‘Nederlands Caribisch gebied’.
Sinds de staatkundige hervorming op 10 oktober 2010 is het Centraal Bureau voor de Statistiek (CBS) verantwoordelijk voor de statistische informatievoorziening over de drie eilanden van Caribisch Nederland (Bonaire, Saba en Sint Eustatius). Om invulling te geven aan deze verantwoordelijkheid is ook een meerjarenprogramma opgesteld (CBS, 2023). Ook publiceert het CBS op StatLine periodiek cijfers over Caribisch Nederland voor een breed aantal thema’s. De CAS-landen hebben ieder hun eigen statistiekbureau: Central Bureau of Statistics Curaçao, Central Bureau of Statistics Aruba en op Sint Maarten het Department of Statistics.
Ook de tekstuele publicaties van het CBS over de Nederlandse Caraïben zijn sinds de staatskundige hervorming volledig gericht op Caribisch Nederland, een enkele uitzondering daargelaten (Hermans en Kösters, 2019). Voor het publiek in het Europees deel van het Koninkrijk betekent dit ook dat er in de pers relatief weinig over statistische ontwikkelingen in de CAS-landen wordt geschreven. Ter gelegenheid van het vijftienjarig jubileum van het huidige staatsbestel is daarom besloten om alle zes de eilanden die oorspronkelijk de Nederlandse Antillen vormden weer eens op een rijtje te zetten. Dit artikel is daarvan het resultaat. Centraal hierin staat de vraag waar de zes eilanden staan als het gaat om zaken als bevolking, taal, arbeidsparticipatie en welvaart. En: hoe hebben zij zich de afgelopen vijftien jaar ontwikkeld?
De cijfers die voor de CAS-landen zijn gebruikt zijn afkomstig van bovengenoemde statistiekbureaus. Niet alle cijfers bleken voor alle eilanden voorhanden. Ook zijn er soms verschillen in gebruikte methodes en het verslagjaar. Er is geen poging gedaan om het effect van verschillende methodes te kwantificeren. Er is geen analyse gedaan naar de oorzaak van verschillen in ontwikkelingen, maar her en der worden wel verklaringen uit de literatuur aangehaald. Wat overblijft is een beeld van de verschillen (en de overeenkomsten) tussen de eilanden, met een kleine slag om de arm wat betreft de vergelijkbaarheid van de opgevoerde cijfers. Het artikel richt zich op eenieder die zich eens wil verdiepen in de zes eilanden aan de hand van de voornaamste sociaaleconomische gegevens.
Hoofdstuk 2 beschrijft de gebruikte databronnen en de onderzoeksmethode. Hoofdstuk 3 gaat over het inwonertal van de zes eilanden en hoe dit zich de afgelopen vijftien jaar heeft ontwikkeld. Ook de bevolkingssamenstelling, de gesproken talen en de religie van de inwoners komen erin aan de orde. Hoofdstuk 4 gaat in op de arbeidsparticipatie en het onderwijsniveau. Hoofdstuk 5 staat stil bij de economie. Hoe groot zijn de economieën, hoe hebben deze zich ontwikkeld en hoe zijn ze opgebouwd? In dit hoofdstuk wordt ook ingegaan op toerisme en inflatie. Het laatste hoofdstuk, de conclusie, zet de belangrijkste bevindingen op een rijtje.
2. Data en Methoden
Omdat voor alle figuren in hoofdstuk 2, 3 en 4 dus minimaal vier verschillende bronnen zijn gebruikt is in paragraaf 2.1 weergegeven waar de informatie vandaan komt. In de figuren zelf is aangegeven over welke periode de cijfers gaan en/of wat het peilmoment van de data betreft.
Voor de CAS-landen zijn vaak geen jaarlijkse gegevens beschikbaar. Er is daarom gekozen om bij een aantal indicatoren enkel de stand in 2025 en de stand in 2011 (of een ander beschikbaar jaar rondom de staatskundige transitie) te laten zien. Voor de gegevens waar deze jaarcijfers wel beschikbaar zijn worden deze getoond.
2.1 Bronnen gebruikte data
Bevolkingsomvang en bevolkingsontwikkeling
Caribisch Nederland; bevolking Curaçao, bevolking
Aruba, bevolking en DBSB, 30 juni 2025
Geslacht en leeftijd
Caribisch Nederland, geslacht en leeftijd
Curaçao, geslacht en leeftijd en Curaçao, leeftijd (Census 2011) Aruba, geslacht en leeftijd en DBSB, 30 juni 2025
Sint Maarten, geslacht en leeftijd (Census 2011 en Census 2022) en Statistiekbureau Sint Maarten
Geboorteland
Caribisch Nederland, geboorteland
Curaçao, geboorteland (Census 2011) en Curaçao, geboorteland (Census 2023) Aruba, geboorteland en DBSB, 30 juni 2025
Sint Maarten, geboorteland (Census 2022 & Census 2011)
Huwelijkse staat
Caribisch Nederland, burgerlijke staat
Curaçao, huwelijkse staat (Census 2011) en Curaçao, huwelijkse staat (Census 2023) Aruba, huwelijkse staat en DBSB, 30 juni 2025
Sint Maarten, huwelijkse staat (Census 2011) en Statistiekbureau Sint Maarten
Talen
Caribisch Nederland, talen en Omnibusenquête
Curaçao, talen (Census 2011) en Curaçao, talen (Census 2023) Aruba: niet beschikbaar
Sint Maarten, talen (Census 2022)
Religie
Caribisch Nederland, kerkelijke gezindte Curaçao, kerkelijke gezindte
Aruba, geboorteland en DBSB, 30 juni 2025
Sint Maarten, kerkelijke gezindte (Census 2022 & Census 2011) en Statistiekbureau Sint Maarten
Netto-arbeidsparticipatie
Caribisch Nederland, netto-arbeidsparticipatie
Curaçao, netto-arbeidsparticipatie en Curaçao, netto-arbeidsparticipatie Aruba, netto-arbeidsparticipatie
Sint Maarten, netto-arbeidsparticipatie
Werkloosheid
Caribisch Nederland, werkloosheid
Curaçao, werkloosheid en Curaçao, werkloosheid Aruba, werkloosheid
Sint Maarten, werkloosheid en Sint Maarten, werkloosheid (Census 2022)
Onderwijsniveau
Caribisch Nederland, hoogst behaald onderwijsniveau en Statistiekbureau Curaçao Curaçao, onderwijsniveau
Sint Maarten: Statistiekbureau Sint Maarten
bbp en bbp-ontwikkeling bbp
Caribisch Nederland, bruto binnenlands product (bbp) Curaçao, bruto binnenlands product (bbp)
Aruba, bruto binnenlands product (bbp)
Sint Maarten, bruto binnenlands product (bbp)
Bruto toegevoegde waarde per bedrijfstak
Bonaire, bruto toegevoegde waarde bedrijfstak Saba en Sint Eustatius: niet beschikbaar
Curaçao, bruto toegevoegde waarde per bedrijfstak Aruba, bruto toegevoegde waarde per bedrijfstak
Sint Maarten, bruto toegevoegde waarde per bedrijfstak
Toerisme
Saba en Sint Eustatius: niet beschikbaar Curaçao, toerisme
Inflatie
Caribisch Nederland, consumentenprijsindex (CPI) Curaçao, consumentenprijsindex (CPI)
Aruba, consumentenprijsindex (CPI)
Sint Maarten, consumentenprijsindex (CPI)
3. Bevolking
Dit hoofdstuk gaat over de bevolking van het Caribisch gedeelte van het Koninkrijk der Nederlanden. Eerst komt het aantal inwoners aan de orde, en de ontwikkeling hiervan in de afgelopen vijftien jaar. Vervolgens wordt ingegaan op de samenstelling van de bevolking.
Verder worden nog de gebruikte talen behandeld en de religie. Wanneer er een duidelijke ontwikkeling plaatsvindt in de vijftien jaar na
de staatskundige hervorming worden ook de cijfers van 2010 of 2011 getoond, indien beschikbaar.
3.1 Bevolkingsomvang
In 2025 woonden in totaal ongeveer 340 duizend personen in het Caribisch deel van het Koninkrijk der Nederlanden (figuur 3.1.1). Dit is iets minder dan het aantal inwoners van de stad Utrecht. Van de CAS-landen heeft Curaçao het hoogste aantal inwoners; in 2025 waren dit er iets meer dan 156 duizend. Het inwoneraantal op Aruba is iets meer dan twee derde van het aantal inwoners op Curaçao, namelijk ruim 108 duizend. Sint Maarten (Nederlandse kant) had in 2023 iets minder dan 43 duizend inwoners. Dit is meer dan het totaal aantal inwoners van Caribisch Nederland.
Van de BES-eilanden is het inwoneraantal het hoogst op Bonaire. Hier woonden op 1 januari 2025 meer dan 26 duizend personen. Op Sint Eustatius woonden begin 2025 iets meer dan 3 duizend inwoners en op Saba iets meer dan 2 duizend. Dat de drie eilanden met de meeste inwoners ook de meeste autonomie hebben is niet toevallig: dit speelde een rol bij de staatskundige hervorming. Het aantal inwoners van Sint Maarten van na 2023 is niet beschikbaar, daarom wordt het inwoneraantal van 2023 getoond als meest recente cijfer.
Ontwikkeling bevolkingsomvang
Figuur 3.1.2 toont dat het aantal inwoners van de meeste eilanden de afgelopen vijftien jaar licht is gestegen, alleen op Sint Eustatius is het aantal inwoners tegenwoordig iets lager dan in 2011. De daling hangt samen met een administratieve opschoning. Of de bevolking in werkelijkheid is gedaald of zelfs is gestegen, valt niet meer te achterhalen. Bonaire vormt op een andere manier een uitzondering: het inwoneraantal van dit eiland is in deze periode relatief hard gegroeid. In 2011 woonden er nog iets meer dan 15 duizend personen en in 2025 waren dit er 26,6 duizend; een toename van bijna 70 procent. De toename is zichtbaar bij alle leeftijdscategorieën, maar het valt op dat de groepen inwoners van 60 jaar en ouder in omvang (meer dan) verdubbeld zijn ten opzichte van 2011. Zie hiervoor ook figuur 3.2.2. De toename van inwoners op Bonaire wordt grotendeels veroorzaakt doordat er meer mensen op het eiland zijn komen wonen dan dat er zijn vertrokken (CBS, 2025a).
In onderstaande figuur wordt de ontwikkeling van de bevolkingsomvang van de zes eilanden getoond. Aangezien het aantal inwoners van Curaçao beduidend groter is dan van bijvoorbeeld Sint Eustatius en Saba, is de ontwikkeling van deze laatste twee eilanden minder goed te zien. Indien u in de legenda onderin de figuur op een bepaald eiland klikt dan kunt u deze uitschakelen. (Dit geldt voor alle figuren.) Bijvoorbeeld: als op Curaçao geklikt wordt onderin de figuur dan wordt deze niet getoond. Op deze manier kunnen de eilanden naar keuze geselecteerd worden en daarmee en wordt de ontwikkeling van de kleine eilanden beter zichtbaar.
In totaal is het inwoneraantal van het Caribisch gedeelte van het Koninkrijk der Nederlanden in die vijftien jaar met een kleine 10 procent toegenomen, van ongeveer 317 duizend inwoners in 2011 naar 340 duizend inwoners in 2025.
3.2 Bevolkingssamenstelling
Geslacht
In figuur 3.2.1 is zichtbaar dat voor Sint Eustatius en Saba de verhouding tussen het aantal mannen en vrouwen precies gelijk is in 2025. Op Curaçao, Sint Maarten en Aruba wonen iets meer vrouwen dan mannen (55 versus 52 procent). Op Bonaire is het andersom. In de afgelopen vijftien jaar is dit beeld weinig veranderd. In 2011 lag het percentage mannen voor de BES-eilanden een enkel procentpunt hoger dan in 2025.

Leeftijd
Curaçao (en in mindere mate ook Aruba) heeft een relatief groot aandeel oudere inwoners. Figuur 3.2.2 toont dat een kwart van de inwoners daar vijfenzestig jaar of ouder is. Voor de BES-eilanden is het aandeel senioren juist veel lager; daar is rond de vijftien procent van de bevolking vijfenzestig jaar of ouder. Alle eilanden zijn in de laatste tien à vijftien jaar sterk vergrijsd. Vooral in Curaçao is het proces snel gegaan. In 2011 was maar 13,8 procent van de bevolking vijfenzestig jaar of ouder; in 2025 als gezegd iets meer dan een kwart. In 2011 was op de BES-eilanden slechts ongeveer 10 procent van de bevolking ouder dan vijfenzestig. In hoeverre migratie ook een rol speelt bij de vergrijzing is niet onderzocht.
Geboorteland
Er zijn grote verschillen in het geboorteland van de bewoners van de zes eilanden (zie figuur 3.2.3). Niet alle bronnen kennen dezelfde indeling. Bijvoorbeeld: in de bron voor Sint Maarten (2022) wordt geen uitsplitsing gemaakt voor Noord en Zuid-Amerika. Daarom vallen deze onder de categorie overig. Voor 2011 was juist enkel een uitsplitsing tussen ‘de voormalige Nederlandse Antillen en Aruba’ en overig beschikbaar. Voor Aruba en Curaçao geldt weer dat voor landen met minder dan 250 personen geboren in dat land onder de groep ‘overig’ vielen bij de bron. Hierdoor is het percentage inwoners van Aruba dat geboren is in een van de BES-eilanden mogelijk lager weergegeven dan de werkelijkheid betreft. Voor 2011 waren er geen cijfers beschikbaar.
Voor Bonaire, Sint Eustatius en Saba geldt in 2024 (meest recente verslagjaar) dat slechts ongeveer een derde van de inwoners ook binnen het BES-gebied is geboren. Een kwart komt uit overig Zuid- en Midden Amerika, en een ander kwart uit een van de CAS-landen. Voor Aruba valt juist op dat het merendeel van de inwoners ook geboren is op de CAS-landen. Voor Bonaire geldt dat 17 procent in Europees Nederland is geboren. Dit percentage is een stuk hoger dan bij de andere eilanden.
Wanneer wordt vergeleken met de samenstelling van de bevolking in 2011 valt het op dat op Bonaire en Saba het percentage inwoners dat in Caribisch Nederland is geboren gedaald is: van respectievelijk 41,7 procent naar 31,9 procent en van 31,7 procent naar 23,7 procent Voor Bonaire geldt dat zowel het aandeel personen geboren in Europees Nederland als het aandeel personen geboren in Midden- en Zuid Amerika is gestegen, voor Saba komt het voornamelijk door een toename van deze laatste groep. Op Sint Eustatius is het aandeel inwoners geboren in Caribisch Nederland juist iets (3,2 procent) toegenomen ten opzichte van 2011.

Huwelijkse staat
Voor de huwelijkse staat van de inwoners zijn de mogelijkheden ingedeeld in vier categorieën; gehuwd, ongehuwd, gescheiden en verweduwd. In het geval dat er bij de bron een categorie ‘geregistreerd partner’ was is deze ingedeeld bij de gehuwden. In figuur 3.2.4 is zichtbaar dat, hoewel op Curaçao en Aruba zowel het percentage gehuwden als het percentage gescheiden inwoners wat hoger ligt dan op de BES-eilanden, de verdeling in 2025 over het geheel genomen vergelijkbaar is voor de zes eilanden. Voor de BES-eilanden geldt dat het aandeel gehuwden is afgenomen in de loop der tijd. Op Curaçao is dat aandeel juist iets toegenomen. Voor alle eilanden is wel een toename zichtbaar voor wat betreft het aandeel gescheiden inwoners.
3.3 Talen
Er worden meerdere talen gesproken in het Caribisch deel van het Koninkrijk der Nederlanden. Het verschilt per eiland wat de officiële talen zijn en wat de voertalen zijn. Ruwweg is de voertaal op de drie bovenwindse eilanden Engels en op de drie benedenwindse eilanden Papiaments. Van het Papiaments bestaan twee hoofdgroepen: op Aruba wordt Papiamento gesproken, op Bonaire en Curaçao Papiamentu. Papiamento heeft een etymologisch georiënteerde spelling, terwijl het Papiamentu fonetisch gespeld wordt. Het Papiaments is een unieke taal die is ontstaan uit een mix van verschillende talen, waaronder het Portugees, Spaans, Nederlands, Engels en diverse Afrikaanse talen.
Officiële talen en voertalen
Op Curaçao zijn de officiële talen het Engels, het Nederlands en het Papiamentu. Op Aruba zijn Nederlands en Papiamento de officiële talen. Op Sint Maarten zijn het Engels en Nederlands. Op de BES-eilanden is Nederlands de officiële taal. Naast Nederlands zijn ook het Papiamentu en het Engels erkend als officiële talen. Dat houdt in dat deze talen gebruikt mogen worden in het onderwijs, het contact met de overheid en de rechtspraak.
De diversiteit aan talen komt ook terug wanneer gekeken wordt naar de voertalen op de eilanden. Op de BES-eilanden heeft het CBS in de Omnibusenquête van 2021 (CBS, 2021) aan personen gevraagd welke taal of welke talen zij spreken. Bij deze vraag waren meerdere antwoorden mogelijk (Papiaments, Engels, Nederlands, Spaans en Anders). Indien de respondent meer dan één taal spreekt is de vraag gesteld welke taal het meest gesproken wordt. Omdat deze cijfers gebaseerd zijn op steekproefonderzoek zitten er marges op deze cijfers. De resultaten hiervan staan weergegeven in figuur 3.3.1.
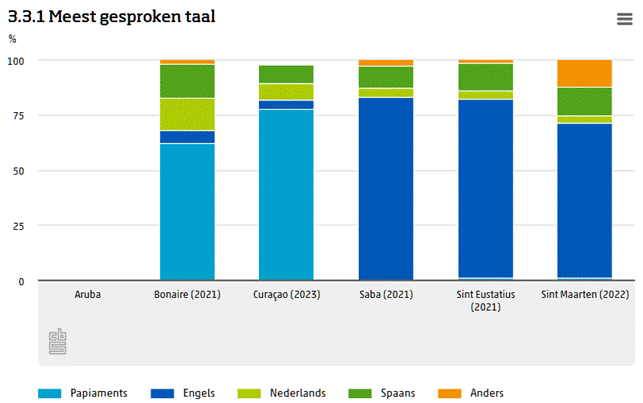
Op Sint Eustatius, Saba en Sint Maarten wordt voornamelijk Engels gesproken. Op Sint Maarten is het voor ongeveer 70 procent van de respondenten de belangrijkste voertaal, op Sint Eustatius en Saba voor meer dan 80 procent. Op Curaçao is het Papiamentu de belangrijkste taal voor bijna 80 procent van de bevolking (CBS Curaçao, 2023a), op Bonaire is het dat voor iets meer dan 60 procent. Op Bonaire is de meest voorkomende taal het minst dominant.
Samenhang tussen de ligging van de eilanden en de voertaal
De eilanden in het Caribisch deel van het Koninkrijk der Nederlanden werden traditioneel onderverdeeld in ‘Benedenwindse eilanden’ en ‘Bovenwindse eilanden’. De Benedenwindse eilanden, ook wel de ABC-eilanden genoemd, zijn Aruba, Bonaire en Curaçao. De Bovenwindse eilanden, ook wel de SSS-eilanden genoemd, zijn Sint Maarten, Sint Eustatius en Saba. De termen verwijzen naar de ligging ten opzichte van de passaatwinden. De Benedenwindse eilanden liggen voor de kust van het Zuid-Amerikaanse land Venezuela. De Bovenwindse eilanden liggen meer dan 800 kilometer noordelijker in de Caribische Zee. De cijfers in figuur 3.3.1 tonen een duidelijke samenhang tussen de voertaal en de ligging van de eilanden. Op de benedenwindse eilanden (Bonaire en Curaçao) is het Papiaments een dominante taal en op de bovenwindse eilanden (Sint Maarten, Sint Eustatius en Saba) het Engels.
Meerdere talen
Naast de voertaal is er ook informatie bekend over welke talen de inwoners van de eilanden überhaupt spreken. Op Bonaire spreekt meer dan 90 procent van de inwoners meer dan één taal. Uit het onderzoek blijkt dat, hoewel Papiaments de voertaal is, op Bonaire dat meer dan driekwart van de mensen óók Engels en Nederlands spreekt. Op Sint Eustatius en Saba geldt voor meer dan de helft van de bevolking dat zij meer dan één taal spreken (CBS, 2022a). Hier wordt Papiaments minder vaak gesproken, maar wordt door ongeveer een derde van de bevolking Nederlands en Spaans gesproken (CBS, 2022b).
3.4 Religie
Het grootste deel van de bevolking van Caribisch Nederland, Curacao en Aruba rekent zich tot een religieuze groepering. Op Sint Eustatius en Saba geven inwoners het vaakst aan dat zij geen godsdienst aanhangen (respectievelijk 22,1 en 20,4 procent). Voor alle eilanden geldt dat het katholicisme verreweg de grootste religie is. Op de grotere eilanden is het aandeel Katholieken meer dan 60 procent. Er lijken niet heel grote verschuivingen plaats te hebben gevonden ten opzichte van 2011, behalve dat er op alle eilanden in 2025 (waarvoor bekend) een groter aandeel van de bevolking aangaf geen godsdienst aan te hangen.
4. Arbeid en onderwijs
In dit hoofdstuk wordt ingegaan op de arbeidsmarkt in de Nederlandse Caraïben. Er wordt bekeken hoeveel mensen er aan het werk zijn en hoe hoog de werkloosheid is, en hoe dit veranderd is in de tijd. Ook het opleidingsniveau van de inwoners komt aan de orde.
4.1. Arbeidsparticipatie en werkloosheid
Bij cijfers over de arbeidsmarkt wordt de bevolking vaak ingedeeld in drie groepen:
- De werkzame beroepsbevolking. Deze bestaat uit personen die betaald werk hebben.
- De werkloze beroepsbevolking. Degenen die geen betaald werk hebben, maar wel recent naar betaald werk hebben gezocht en daarvoor direct beschikbaar zijn.
- De niet-beroepsbevolking. Deze bestaat uit personen zonder betaald werk die niet recent naar werk hebben gezocht of daarvoor niet direct beschikbaar zijn. Reden hiervoor kunnen bijvoorbeeld zijn arbeidsongeschiktheid en de zorg voor naasten.
Werkenden en werklozen vormen samen de beroepsbevolking. Op de BES-eilanden is het gebruikelijk om de leeftijd van de drie groepen te beperken van 15 tot 75 jaar. De bovengrens wordt in de CAS-landen niet aangehouden. De institutionele bevolking (CBS, 2022), bewoners van bijvoorbeeld verpleeghuizen of gevangenissen, wordt niet meegeteld. Of deze groep wordt meegeteld bij de CAS-landen is onduidelijk.
Netto-arbeidsparticipatie
Het percentage van de bevolking met betaald werk wordt de netto-arbeidsparticipatie genoemd. Dit is het aandeel van de werkzame beroepsbevolking op de totale bevolking (zowel de beroeps- als de niet-beroepsbevolking). In figuur 4.1.1 is de netto-arbeidsparticipatie voor de zes eilanden weergegeven voor de periode 2012 tot en met 2024. Opgemerkt dient te worden dat in dit hoofdstuk geen sprake is van een continue ontwikkeling aangezien het AKO (Arbeidskrachtenonderzoek) op Caribisch Nederland niet jaarlijks, maar tweejaarlijks uitgevoerd wordt. Voor Sint Maarten geldt dat niet dezelfde jaren beschikbaar zijn als voor de andere eilanden. Daarom staan er in de figuur voor Sint Maarten bij 2012 gegevens over 2011, bij 2014 gegevens over 2013 en bij 2016 gegevens over 2017.
Op alle zes de eilanden heeft het merendeel van de bevolking betaald werk. Er kunnen meerdere redenen zijn waarom personen niet kunnen of willen werken. Op Bonaire en Sint Eustatius was de netto-arbeidsparticipatie de laatste jaren meer dan 70 procent. Op Saba lag deze iets lager, namelijk 67 procent. Dit komt doordat er een grote universiteit op dit eiland is, waardoor een gedeelte van de inwoners niet tot de beroepsbevolking behoort (de studenten). De arbeidsparticipatie voor Aruba en Curaçao ligt structureel lager dan die van de BES-eilanden. De vergelijking tussen de CAS-landen en de BES-eilanden wordt echter beperkt door de verschillende leeftijdsafbakening. De arbeidsparticipatie is voor alle eilanden redelijk constant geweest gedurende de onderzoeksperiode.
Werkloosheid
Een andere belangrijke economische indicator is het werkloosheidspercentage. Hiervoor wordt gekeken naar de werkloze beroepsbevolking. In figuur 4.1.2 staat de ontwikkeling van het werkloosheidspercentage voor de zes eilanden weergegeven. De leeftijdsafbakening is hetzelfde als bij de arbeidsparticipatie. Ook hier geldt dat voor Sint Maarten niet dezelfde jaren beschikbaar zijn als voor de andere eilanden. Daarom staan er in de figuur voor Sint Maarten bij 2012 gegevens over 2011, bij 2014 gegevens over 2013 en bij 2016 gegevens over 2017.
Op Curaçao is de werkloosheid in de hele onderzoeksperiode het hoogst. Niet aan te geven is of de verschillende leeftijdsafbakeningen hierbij een rol spelen. In eerder onderzoek worden meerdere redenen genoemd waarom de werkloosheid op dit eiland relatief hoog is. Voorbeelden hiervan zijn het algemene functioneren van de economie op Curaçao, de sterke afhankelijkheid van een beperkt aantal bedrijfstakken (gebrek aan diversificatie) en het functioneren van de arbeidsmarkt (bijvoorbeeld bureaucratische belemmeringen en traagheid in de vergunningsprocedure). Voor meer informatie over de arbeidsmarkt op Curaçao, zie Analyse van de arbeidsmarkt op Curaçao (CBS Curaçao, 2023b). De werkloosheid op dit eiland is, met uitzondering van de piek tijdens corona, wel gedaald ten opzichte van 2016. In dat jaar was het werkloosheidspercentage nog meer dan 13 procent, in 2024 was dit afgenomen naar minder dan 8 procent.
Op Aruba en Bonaire is de werkloosheid afgelopen jaren ook afgenomen. Op Aruba van meer dan zeven procent in 2016 naar iets meer dan 4 procent in 2024 en op Bonaire van meer dan 6 procent in 2016 naar ongeveer 2 procent in 2024. Op Saba is de werkloosheid, in vrijwel alle jaren, het laagst. In 2024 was de werkloosheid op dit eiland minder dan twee procent. Ook in eerder onderzoek dat CBS uitvoerde was de werkloosheid op Saba het laagst (Hermans en Kösters, 2019). De werkloosheid op Sint Eustatius schommelt enigszins. De economie op dit eiland wordt sterk beïnvloed door enkele grote bedrijven. Deze bedrijven produceren voornamelijk voor de export en zijn afhankelijk van regionale ontwikkelingen in de oliesector.
Omdat alle eilanden populaire vakantiebestemmingen zijn, zijn de sectoren toerisme, handel en de horeca de bedrijfstakken die voor de meeste werkgelegenheid zorgen. Elk eiland wordt echter gekenmerkt door een andere sectorstructuur. Hierover staat meer geschreven in hoofdstuk vijf.
4.2 Onderwijsniveau
In deze paragraaf wordt gekeken naar het hoogst behaalde opleidingsniveau van de inwoners van de zes eilanden. In figuur 4.2.1 is het hoogst behaalde niveau weergegeven voor de eilanden waarvoor de informatie beschikbaar was. De informatie gaat over 2016 en over het laatst beschikbare jaar: 2024. Het onderwijsniveau wordt ingedeeld in drie categorieën: ‘basisonderwijs/vmbo of mbo1’ als hoogst behaalde opleiding, ‘havo/vwo of mbo 2-4’ als hoogst behaalde opleiding en ‘hbo of wo’ als hoogst behaalde opleiding. Voor Sint Maarten en Curaçao is een grovere indeling gebruikt.

De meeste inwoners van de eilanden hebben ‘basisonderwijs/vmbo of mbo1’ als hoogst behaalde opleiding. Op de eilanden Bonaire, Sint Eustatius en Curaçao gaat het om 30 tot 50 procent van de populatie. Ongeveer 15 tot 25 procent van de inwoners heeft een hbo- of wo-diploma op zak. Saba laat een ander beeld zien: het percentage inwoners met een hbo- of wo-opleiding is hier relatief hoog, namelijk méér dan een kwart. Dit komt door de grote medische universiteit die op dit eiland gevestigd is. Door afronding van percentages in de bron tellen niet alle landen op tot 100 procent. De cijfers zijn daardoor indicatief.
Het opleidingsniveau van de BES-eilanden is vanaf 2016 iets veranderd. Een kleiner aandeel heeft tegenwoordig ‘basisonderwijs/vmbo of mbo1’ als hoogst behaalde opleiding. Voor de overige eilanden zijn oudere cijfers niet bekend.
Een bekend probleem is dat jongeren van de eilanden in het Caribisch deel van het Koninkrijk der Nederlanden elders gaan studeren, bijvoorbeeld in Europees Nederland, en dat zij na hun studie niet direct terugkeren naar waar ze vandaan kwamen. Zo laten schattingen zien dat op Curaçao elk jaar honderden jongeren het eiland verlaten om elders te gaan studeren en dat maar ongeveer vijf procent van deze jongeren na hun studie terugkeert (CBS Curaçao, 2023c). Ook uit het meest recente scholierenonderzoek op de BES-eilanden (Bokern en Fernandez Beiro, 2025) blijkt dat een groot deel van de jongeren aangaf in de toekomst het eiland te willen verlaten om elders te gaan wonen. Op Bonaire ging dat om 81 procent van de jongeren en op Saba en Sint Eustatius zelfs om 91 procent. Op alle drie de eilanden waren ‘het volgen van een opleiding of studie’ en ‘meer van de wereld zien’ de meest genoemde redenen hiervoor.
Het gevolg van deze wegtrekkende jongeren is dat het gemiddelde opleidingsniveau van inwoners van de zes eilanden relatief laag is. Ter vergelijking: in Europees Nederland (CBS, 2025b) heeft iets meer dan een kwart van de personen van 15 tot 75 jaar ‘basisonderwijs/vmbo of mbo1’ als hoogst behaald onderwijsniveau, ongeveer 41 procent ‘havo/vwo of mbo 2-4’ en bijna een derde ‘hbo of wo’. Het wegtrekken en wegblijven van hbo en wo-geschoolden kan invloed hebben op de lokale arbeidsmarkt en op de economieën van de eilanden. Ook de bevolkingssamenstelling zou hierdoor beïnvloed kunnen worden, bijvoorbeeld doordat migranten aangetrokken moeten worden om openstaande vacatures te vervullen.
5. Economie en toerisme
In dit hoofdstuk wordt ingegaan op de economieën van de zes eilanden. Hoe omvangrijk zijn de economieën en hoe was in de voorbije jaren de economische groei? Op welke bedrijfstakken drijven de verschillende eilanden? Tot slot komt de inflatie aan de orde.
5.1 Bruto binnenlands product
Een vaak gehanteerde maat om de omvang van de economie in kaart te brengen is het bruto binnenlands product (bbp). Het bbp is grofweg gelijk aan wat er in een land geproduceerd, verdiend of uitgegeven wordt. In de Nulmeting monitor macro-economische context Caribisch Nederland (CBS, 2024) staat meer informatie gegeven over hoe dit gemeten wordt. Het bbp per inwoner staat voor de welvaart in engere zin. ‘Brede welvaart’ komt in dit artikel niet aan de orde. Vooraleer wordt ingegaan op het bbp, worden eerst de verschillen in munteenheid besproken.
Munteenheid
De eilanden hebben niet allemaal dezelfde munteenheid. De officiële munteenheid in 2025 van Curaçao en Sint Maarten is de Caribische gulden. Deze is sinds 31 maart 2025 de opvolger van de Nederlands-Antilliaanse gulden. De Arubaanse florin is de munteenheid van Aruba. Deze werd ingevoerd nadat Aruba in 1986 de status aparte kreeg binnen het Koninkrijk der Nederlanden (daarvoor werd ook hier de Antilliaanse gulden gebruikt). Op de BES-eilanden is sinds 1 januari 2011 de Amerikaanse dollar het wettige betaalmiddel. Toerisme en handel hebben een rol gespeeld bij de keuze voor de munteenheid. Om de omvang van de economie tussen de zes eilanden te kunnen vergelijken, zijn alle bedragen omgerekend naar Amerikaanse dollars.
Zoals figuur 5.1.1 toont zijn Aruba en Curaçao de economische reuzen, de overige economieën zijn een stuk kleiner. Dit weerspiegelt voor een deel het inwoneraantal: hoe meer inwoners, hoe meer mensen produceren en consumeren. Dat is echter niet de enige factor. Zo heeft Aruba niet het hoogste inwonertal, maar wel het hoogste bbp. Om het welvaartsniveau tussen de eilanden te vergelijken, kijkt men in de regel naar het bbp per inwoner. Dat ligt zoals te zien in Figuur 5.1.2 verreweg het hoogst op Sint Eustatius (cijfers 2021). Dat op Bonaire, Saba en Aruba is behoorlijk vergelijkbaar. Op Curaçao en Sint Maarten ligt het een stuk lager. De cijfers zijn niet gecorrigeerd voor verschillen in koopkracht (voor het equivalent van 1 Amerikaanse dollar kun je op het ene eiland meer kopen dan op het andere).
5.2 Ontwikkeling van het bbp
Figuur 5.2.1a geeft de volumeontwikkeling van het bbp ten opzichte van het voorafgaande jaar, een maat voor de economische ontwikkeling. Een negatieve uitschieter is het jaar 2020 toen de economie op alle zes de eilanden kromp. In dat jaar waren er vanwege de coronapandemie reisbeperkingen, die een grote impact hadden op het toerisme. Na 2020 volgde wel een sterk herstel het jaar erna. Opvallend is dat de economie van met name Sint Eustatius sterk schommelt. Dit heeft te maken met de afhankelijkheid van het eiland van enkele grote bedrijven. Dit betekent ook dat het bbp per inwoner zoals gepresenteerd in de vorige paragraaf sterk afhankelijk is van het gekozen vergelijkingsjaar.

Om meer inzicht te krijgen in de groei over langere termijn, is de volumeontwikkeling van het bbp in figuur 5.2.1b geïndexeerd vanaf 2013. Voor Aruba en Sint Maarten ontbreken de eerste jaren in de reeks. Voor deze eilanden begint de grafiek daarom later, op de gemiddelde index van de andere eilanden in dat jaar. Duidelijk wordt dat het bbp van Bonaire het meest is gestegen sinds 2013, en dat dat van Sint Eustatius is gekrompen. Op de overige eilanden is de economie licht gegroeid; de eilanden ontlopen elkaar niet veel. Ten opzichte van Europees Nederland was de groei vanaf 2013 bescheiden: het bbp van Europees Nederland lag in 2022 bijna een kwart boven dat in 2013.
5.3 Bruto toegevoegde waarde per bedrijfstak
Voor de vier grootste eilanden is ook informatie bekend over de bruto toegevoegde waarde per bedrijfstak. Dit geeft inzicht in hoe de economieën zijn opgebouwd en of deze bijvoorbeeld afhankelijk zijn van een beperkt aantal bedrijfstakken. De cijfers worden getoond voor 2021, het meest recente jaar waarvoor de cijfers voor alle vier de grotere eilanden bekend zijn. Deze informatie is niet beschikbaar voor Sint Eustatius en Saba omdat het CBS gebonden is aan onthullingsregels. Hierdoor is het niet mogelijk om de cijfers van bepaalde bedrijfstakken op Sint Eustatius en Saba te publiceren. Het getoonde jaar was echter midden in de coronaperiode en kan daardoor mogelijk een vertekend beeld geven. Cijfers over de periode net na de staatskundige hervorming zijn niet beschikbaar.
R-U Cultuur, recreatie, overige diensten
Zoals figuur 5.3.1 toont is op Curaçao de financiële dienstverlening erg belangrijk voor de lokale economie. Het gaat hier om bijna een kwart van de totale toegevoegde waarde van het eiland. Binnen deze bedrijfstak vallen diverse banken, verzekeringsmaatschappijen en andere financiële instellingen. Voor alle vier de eilanden wordt het belang van toerisme duidelijk. Zo is op Aruba de horeca de belangrijkste bedrijfstak. Ook is bijvoorbeeld de handel op alle eilanden een relatief grote sector. Hierbinnen valt ook de detailhandel, zoals de winkels en markten. Ook de zakelijke dienstverlening wordt door toerisme gestimuleerd. Hierin zit bijvoorbeeld de verhuur auto’s en reisbemiddeling.
5.4 Toerisme
Zoals ook bleek uit de vorige paragraaf is toerisme op alle eilanden economisch gezien een van de belangrijkste bedrijfstakken. Om een beeld te geven van de ontwikkeling en de verhouding van het aantal toeristen op de eilanden is in figuur 5.4.1 het aantal cruisepassagiers weergegeven voor de periode 2011 tot en met 2023. (De grote cruisemaatschappijen doen Saba en Sint Eustatius niet aan.) Voor veel eilanden zijn cruiseboten een belangrijke bron van inkomsten. Duidelijk wordt allereerst het verwoestende effect van de coronacrisis. Na drie slechte jaren kwam het aantal passagiers in 2023 eindelijk weer in de buurt van het précorona-niveau.
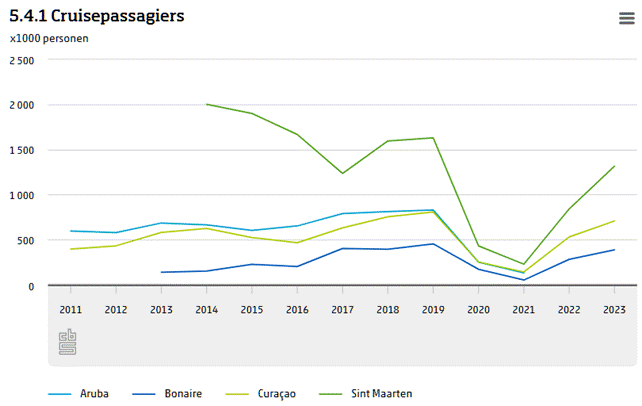
Sint Maarten kent verreweg de meeste cruisepassagiers. Voor Sint Maarten was de coronadip dan ook het heftigst. Het aantal toeristen dat per cruiseschip naar Bonaire komt is doorgaans een stuk lager dan voor de CAS-landen.
5.5 Inflatie
Tot slot wordt er in dit hoofdstuk gekeken naar de inflatie. Inflatie is de gemiddelde prijsstijging van consumentenproducten. Om de inflatie goed te kunnen meten moet eerst in kaart gebracht worden waar bewoners van de eilanden hun geld aan uit geven. Vervolgens wordt gekeken naar de kosten van de goederen en diensten die bewoners kopen. Het CBS doet dit voor Bonaire, Sint Eustatius en Saba door schriftelijke enquêtes, internetwaarneming, externe registraties en een deel van de prijzen wordt genoteerd door interviewers die langs winkels gaan. In de Nulmeting van de monitor macro-economische context (CBS, 2024) staat meer informatie over hoe het CBS inflatie meet.
Aangezien de methodes om inflatie in kaart te brengen niet uniform zijn, kan dit de vergelijkbaarheid van de resultaten beïnvloeden. Ook verschillen in het uitgavenpatroon van consumenten zijn van invloed op de inflatie. Hier moet rekening mee gehouden worden bij het interpreteren van onderstaande cijfers. De periode waarvoor de cijfers beschikbaar zijn, verschilt ook sterk tussen de eilanden. Zo zijn voor Curaçao cijfers bekend vanaf 1970 en voor Sint Maarten pas vanaf 2019. In figuur 5.5.1 wordt de inflatie geïndexeerd weergegeven vanaf de staatskundige transitie (2011). Voor Sint Maarten is voor het eerst beschikbare jaar een index genomen gelijk aan het gemiddelde van de andere eilanden in dat jaar.
Zoals figuur 5.1.1 laat zien, zijn de prijzen op Curaçao het sterkst gestegen. Zo lagen hier in 2024 de prijzen 36,6 procent hoger dan in 2011. Dat is overigens nog iets beneden Europees Nederland, waar de prijzen met 39 procent stegen. Op Aruba zijn de prijzen met 13,4 procent het minst gestegen. De inflatie schommelt voor de meeste eilanden jaarlijks rond de twee procent, met als duidelijke uitschieter het jaar 2022. Op alle eilanden in het Caribisch deel van het Koninkrijk der Nederlanden was de inflatie toen veel hoger: van 3,6 procent op Sint Maarten en naar 10 procent op Bonaire. De hogere inflatie was wereldwijd. Vaak genoemde oorzaken van deze wereldwijde piek in inflatie zijn het herstel na de COVID-19-pandemie en de Russische invasie in Oekraïne.
Ook in de eerste jaren na de staatskundige transitie in 2010 zijn de inflatiecijfers relatief hoog. Er is onderzoek geweest naar de mogelijke oorzaken van deze prijsstijgingen in Caribisch Nederland (Ecorys en Curconsult, 2017). Na de hervorming zijn er meerdere stelselwijzigingen (belastingen, douane, zorg, sociale zekerheid) doorgevoerd in een in relatief korte periode. Dergelijke wijzigingen brachten onzekerheid met zich mee. Dit heeft, in combinatie met de wisseling van de Antilliaanse gulden naar de Amerikaanse dollar, gezorgd voor een opwaarts prijseffect. Daarnaast zijn er ook macro-economische oorzaken voor de relatief sterke prijsstijgingen in deze periode, zoals hoge olie- en voedselprijzen, wisselende valutakoersen en bovendien was er onrust in een belangrijk aanvoerland; Venezuela.
6. Conclusie
In totaal is het inwoneraantal van het Caribisch gedeelte van het Koninkrijk der Nederlanden met een kleine 10 procent toegenomen na de staatskundige transitie, naar 340 duizend inwoners in 2025. Deze stijging wordt grotendeels veroorzaakt door een toename van de bevolking op Bonaire: deze is met bijna 70 procent (11 duizend inwoners) gestegen sinds 2011. De toename van inwoners op Bonaire wordt grotendeels veroorzaakt doordat er meer mensen op het eiland zijn komen wonen dan dat er zijn vertrokken.
De bevolking is gemiddeld ouder dan vijftien jaar geleden. Voor alle eilanden geldt dat er meer vijfenzestigplussers wonen dan in 2011 of een vergelijkbaar jaar. Op Curaçao is de toename van senioren het sterkst; het aantal vijfenzestigplussers steeg daar van 15,3 procent in 2015 naar 25,3 procent in 2025.
Veel eilandbewoners zijn niet afkomstig van de eilanden zelf: voor Bonaire, Sint Eustatius en Saba geldt dat een derde van de inwoners uit 2024 ook daadwerkelijk binnen het BES-gebied is geboren. Voor Bonaire en Saba geldt dat het aandeel inwoners geboren in Caribisch Nederland is afgenomen met respectievelijk 10 en 8 procentpunt. Er zijn meer personen met een Nederlandse herkomst of een Midden- en Zuid Amerikaanse herkomst gaan wonen. Voor Aruba (62 procent) en Sint Maarten (41,6 procent) ligt het aandeel inwoners dat geboren is binnen het CAS-gebied veel hoger.
Op alle zes de eilanden heeft het merendeel van de bevolking betaald werk. De arbeidsparticipatie voor de CAS-landen ligt echter structureel lager dan die van de BES-eilanden, en de werkloosheid juist hoger. Wel is het zo dat de werkloosheid de afgelopen jaren op alle eilanden is afgenomen. Een bekend probleem op de eilanden is dat jongeren van de eilanden in het Caribisch deel van het Koninkrijk der Nederlanden elders gaan studeren, bijvoorbeeld in Europees Nederland, en dat zij na hun studie niet terugkeren naar het eiland. Het gevolg van deze wegtrekkende jongeren is dat het gemiddelde opleidingsniveau van inwoners van de zes eilanden relatief laag is. Het wegtrekken en wegblijven van hbo- en wo-geschoolden kan invloed hebben op de lokale arbeidsmarkt en op de economieën van de eilanden.
Het bbp per inwoner ligt overduidelijk het hoogste op Sint Eustatius en het laagst op Curaçao en Sint Maarten. Dat van de overige drie eilanden is vergelijkbaar. De economie van Sint Eustatius groeide vanaf 2013 wel het traagst, dat van Bonaire het snelst. De prijzen zijn vanaf 2011 het snelst gestegen op Curaçao en op Aruba het traagst.
Bronnen
Bokern, Paul, en Linda Fernandez Beiro, 2024, Jongeren in Caribisch Nederland: resultaten Scholierenonderzoek CBS, 2020, Definitie institutionele bevolking
CBS, 2021, Omnibusenquête Caribisch Nederland
CBS, 2022a, Caribisch Nederland, spreekt meer dan één taal CBS, 2022b, Caribisch Nederland, gesproken talen
CBS, 2023, CBS meerjarenprogramma Caribisch Nederland 2024-2028
CBS, 2024, Nulmeting monitor macro-economische context Caribisch Nederland
CBS, 2025a, Caribisch Nederland; bevolkingsontwikkeling, geboorte, sterfte en migratie CBS, 2025b, Bevolking; hoogstbehaald onderwijsniveau en regio
CBS Curaçao, 2023a, Population by most spoken language at home CBS Curaçao, 2023b, Analy se van de arbeidsmarkt op Curaçao 2023 CBS Curaçao, 2023c, Educational attainment and Outcome in Curaçao
Ecorys en Curconsult, 2017, Onderzoek naar prijzen in Caribisch Nederland
Hermans, Brigitte en Lian Kösters, 2019, Beroepsbevolking op de Nederlands-Caribische eilanden Wereldbank, 2025, Inflation, consumer prices
ENGELS:
THE DUTCH CARIBBEAN 15 YEARS AFTER THE DISSOLUTION OF THE NETHERLANDS ANTILLES
In the wake of the constitutional reform of the Dutch Caribbean in 2010, we compare the six constituent islands. The topics under review are population, work, education, economics and tourism. Alongside the current situation, we consider the changes over the years 2010- 2025.
* The authors are grateful to Sabrina de Regt for her contribution to this article.
** This article is also available in Dutch and Papiamentu.
1. Introduction
On 10 October 2010, a constitutional reform of the Kingdom of the Netherlands took place. On that date, the country the ‘Netherlands Antilles’ was dissolved. At the time, the Netherlands Antilles consisted of five islands: Curaçao, St Maarten, Bonaire, St Eustatius and Saba. Aruba was previously also part of the Netherlands Antilles, but in 1986 was granted status aparte. This meant that it became an independent country, but was still part of the Kingdom of the Netherlands.
Since the constitutional transition in 2010, the Kingdom of the Netherlands has consisted of four countries: Curaçao, Aruba, St Maarten and the Netherlands. The former group of countries are also abbreviated as the ‘CAS countries’. The country of the Netherlands consists of a European part and a Caribbean part. The Caribbean Netherlands comprises the public entities of Bonaire, St Eustatius (English: Statia) and Saba. These three islands are also referred to as ‘special municipalities’ and by the abbreviation the ‘BES islands’. These six islands are known collectively as the Dutch Caribbean.
Since the constitutional reform came into effect on 10 October 2010, Statistics Netherlands (CBS) has been responsible for providing statistical information on the three islands of the Caribbean Netherlands (Bonaire, Saba and St Eustatius). In order to fulfil this responsibility, a separate multi-annual programme for the Caribbean Netherlands has also been drafted (CBS, 2023).
CBS also publishes periodic figures for the Caribbean Netherlands on a broad range of subjects at StatLine. The CAS countries each have their own statistics agency: Central Bureau of Statistics Curaçao, Central Bureau of Statistics Aruba and on St Maarten the Department of Statistics.
Since the constitutional reform, CBS text based publications on the Dutch Caribbean have also been entirely focused on the Caribbean Netherlands, with a few exceptions (Hermans and Kösters, 2019). For the public in the European part of the Kingdom, this also means that relatively little is written in the press about statistical developments in the CAS countries. On the occasion of the fifteenth anniversary of the current constitutional arrangement, it was therefore decided to take a closer look at all six islands that originally made up the Netherlands Antilles. This article is the result. It focuses on the current position of the six islands in terms of population, language, labour force participation, economic prosperity, etc., as well as how they have developed over the past fifteen years.
The figures used for the CAS countries are derived from the statistics agencies listed above. Not all figures were available for all countries. Moreover, there are some differences in terms of the methods used and reporting years. We have not attempted to quantify the effect of different methods. No analysis is offered of the causes of differences in developments, but here and there explanations are cited from the literature. What remains is a picture of the differences (and similarities) between the islands, with a small caveat with regard to the comparability of the figures presented. The article is aimed at anyone who wishes to explore the six islands based on the primary socio- economic data.
Chapter 2 describes the data sources and research method used. Chapter 3 considers the population sizes of the six islands and how they have changed over the past fifteen years. It also discusses the population composition, the languages spoken and the religions of the inhabitants. Chapter 4 covers labour force participation and educational attainment. Chapter 5 focuses on economics: how big are the economies, how have they changed over time and how are they structured? This chapter also looks at tourism and inflation. The final chapter, the conclusion, lists the main findings.
2. Data and methods
Because, as noted, there are at least four different sources for all the charts in chapters 2, 3 and 4, Section 2.1. shows where the information has been obtained. The periods the figures relate to and/or the reference dates for the data are specified in the charts themselves.
In many cases, no annual data are available for the CAS countries. For this reason, for a number of indicators it has been decided to only show the status in 2025 and in 2011 (or another available year around the constitutional reform). For indicators for which annual figures are available, the figures are shown.
2.1 Sources used for each indicator
Population, size and changes over time
Caribbean Netherlands; population Curaçao, population
Aruba, population and DBSB, 30 June 2025
Gender and age
Caribbean Netherlands, Gender and age
Curaçao, Gender and age and Curaçao, age (Census 2011) Aruba, Gender and age and DBSB, 30 June 2025
St Maarten, Gender and age (Census 2011 and Census 2022) and Statistics Bureau St Maarten
Country of birth
Caribbean Netherlands, country of birth
Curaçao, country of birth (Census 2011) and Curaçao, country of birth (Census 2023) Aruba, country of birth and DBSB, 30 June 2025
St Maarten, country of birth (Census 2022 & Census 2011)
Marital status
Caribbean Netherlands, marital status
Curaçao, marital status (Census 2011) and Curaçao, marital status (Census 2023) Aruba, marital status and DBSB, 30 June 2025
St Maarten, marital status (Census 2011) and Statistics Bureau St Maarten
Languages
Caribbean Netherlands, languages and Omnibus survey
Curaçao, languages (Census 2011) and Curaçao, languages (Census 2023) Aruba: not available
St Maarten, languages (Census 2022)
Religion
Caribbean Netherlands, religion Curaçao, religion
Aruba, country of birth and DBSB, 30 June 2025
St Maarten, religion (Census 2022 & Census 2011) and Statistics Bureau St Maarten
Net labour participation rate
Caribbean Netherlands, net labour participation rate
Curaçao, net labour participation rate and Curaçao, net labour participation rate Aruba, net labour participation rate
St Maarten, net labour participation rate
Unemployment
Caribbean Netherlands, unemployment
Curaçao, unemployment and Curaçao, unemployment Aruba, unemployment
St Maarten, unemployment and St Maarten, unemployment (Census 2022)
Level of education
Caribbean Netherlands, highest level of education attained and Statistics Bureau Curaçao Curaçao, level of education
St Maarten: Statistics Bureau St Maarten
GDP and change in GDP over time
Caribbean Netherlands, gross domestic product (GDP) Curaçao, gross domestic product (GDP)
Aruba, gross domestic product (GDP)
St Maarten, gross domestic product (GDP)
Gross added value by industry or sector
Bonaire, gross added value by industry or sector
Saba and St Eustatius: not available
Curaçao, gross added value by industry or sector Aruba, gross added value by industry or sector
St Maarten, gross added value by industry or sector
Tourism
Saba and St Eustatius: not available Curaçao, tourism
Inflation
Caribbean Netherlands, consumer price index (CPI) Curaçao, consumer price index (CPI)
Aruba, consumer price index (CPI)
St Maarten, consumer price index (CPI)
3. Population
This chapter covers the population in the Caribbean part of the Kingdom of the Netherlands. First, we consider the number of inhabitants, along with changes to that number over the past fifteen years. We then discuss the composition of the population, as well as the languages spoken and the religion practised on the islands. Where there has been a clear development in the fifteen years since the constitutional reform, the figures for 2010 or 2011 are also shown, if available.
3.1 Population size
In 2025, there were approximately 340 thousand people living in the Caribbean part of the Kingdom of the Netherlands (Chart 3.1.1). That is slightly less than the population of the city of Utrecht. Of the CAS countries, Curaçao has the highest number of inhabitants – a little over 156 thousand in 2025. The population of Aruba is slightly more than two-thirds that of Curaçao, at over 108 thousand. St Maarten (specifically, the Dutch part of the island) had slightly fewer than 43 thousand inhabitants in 2023. That is more than the total population of the Caribbean Netherlands.
Of the BES islands, Bonaire has the highest number of inhabitants. On 1 January 2025, it was home to more than 26 thousand people. At the start of 2025, there were more than 3 thousand people living on St Eustatius and just over 2 thousand on Saba. The fact that the three islands with the most inhabitants also have the most autonomy is not coincidental: population size played a role in the constitutional reform. The number of inhabitants on St Maarten is not available after 2023, which is why the population of 2023 is given as the most recent figure.

Changes in population size
Chart 3.1.2 shows that the populations of most of the islands have increased slightly over the past fifteen years; only St Eustatius has slightly fewer inhabitants today than in 2011. That decrease is related to an administrative clean-up. At this juncture, it is impossible to know whether the population contracted or actually grew. Bonaire represents an exception in a different sense: the population of this island grew relatively quickly in this period. In 2011, it was home to slightly more than 15 thousand people, while by 2025 that number had risen to 26.6 thousand, an increase of nearly 70%. The growth is seen in all age categories, but it is notable that the population groups aged 60 and over have more than doubled in size compared to 2011. See also Chart 3.2.2. The increase in the population of Bonaire is largely attributable to the fact that more people have moved to the island than have left (CBS, 2025a).
The chart below shows changes in the population sizes of the six islands. Given that the population of Curaçao is significantly larger than, for example, that of St Eustatius and Saba, the development of the latter two islands is less easy to distinguish. If you click on a particular island in the legend at the bottom of the chart, you can deselect it. For example, if you click on Curaçao at the bottom of the chart, that island will not be displayed. In this way, the islands can be selected as desired, showing the development of the small islands more clearly.
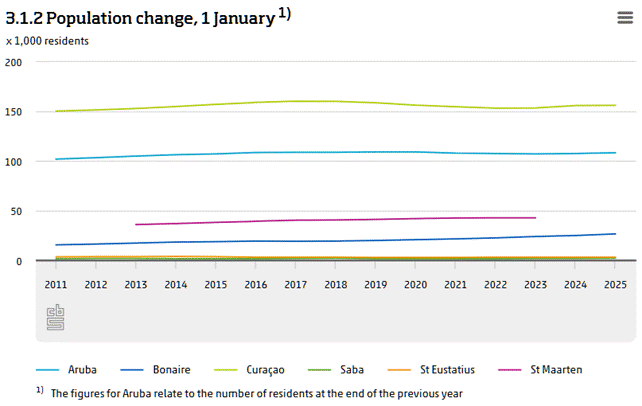
The total population of the Caribbean part of the Kingdom of the Netherlands has grown by slightly less than 10% over the past fifteen years, from approximately 317 thousand in 2011 to 340 thousand in 2025.
3.2 Population composition
Gender
Chart 3.2.1 reveals that the ratio of men to women is precisely equal on St Eustatius and Saba in 2025. There are slightly more women than men on Curaçao, St Maarten and Aruba (55% versus 52%), while the situation on Bonaire is reversed. This picture has changed little over the past fifteen years. In 2011, the share of men was a single percentage point higher for the BES than in 2025.
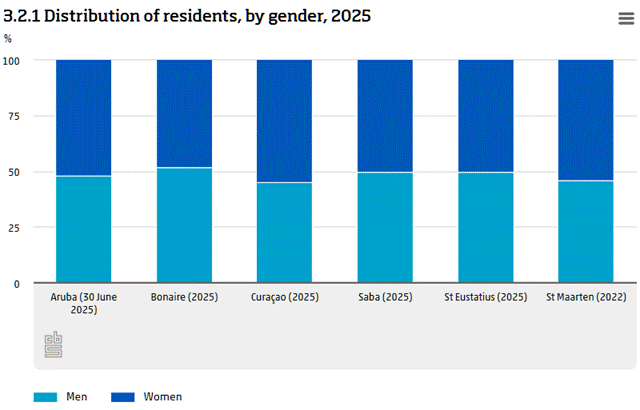
Age
Curaçao (and to a lesser extent Aruba) has a relatively large proportion of older inhabitants. Chart 3.2.2 shows that a quarter of residents there are aged 65 or over. By contrast, the share of older people is much lower for the BES islands: there, around 15% of the population are aged 65 or over. There has been significant ageing of the populations of all the islands over the past ten to fifteen years. The process has been particularly rapid on Curaçao. In 2011, only 13.8% of the population there were aged sixty-five or over; as stated, by 2025 that share had grown to slightly over a quarter. In 2011, only approximately 10% of the population of the BES islands were older than 65. The role of migration in the changing age profile of the population has not been investigated.
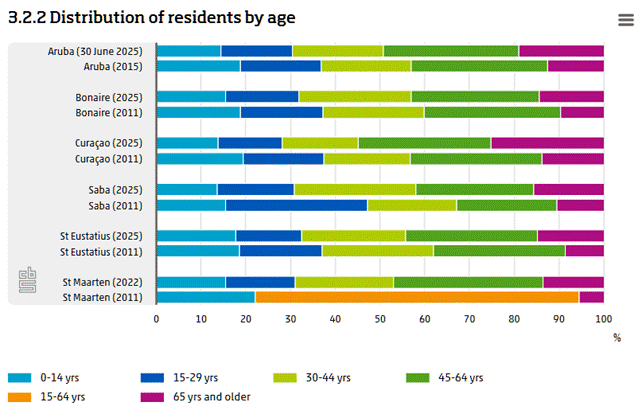
Country of birth
There are major differences between the six islands in terms of the country of birth of their inhabitants (see Chart 3.2.3). The classification used is not the same for all sources. For example, in the source for St Maarten (2022), no distinction is drawn between North and South America. For this reason, they both fall under the ‘other’ category. Conversely, in 2011, the only distinction made was between ‘the former Netherlands Antilles and Aruba’ and ‘other’. For Aruba, countries with fewer than 250 people born in that country fell under the ‘other’ category in the source. As a result, the percentage given for Aruban inhabitants born in one of the BES islands may be understated. No figures were available for 2011.
For Bonaire, St Eustatius and Saba, in 2024 (the most recent reporting year), only approximately one-third of inhabitants were actually born within the BES area. A quarter originated from other parts of South and Central America, and another quarter from one of the CAS countries. For Aruba and Curaçao, on the other hand, it is notable that the majority of the population were born in the CAS countries. Of the population of Bonaire, 17% were born in the European Netherlands. This percentage is significantly higher than for the other islands.
If we compare the composition of the population in 2024 with that in 2011, we note that on Bonaire and Saba, the percentage of inhabitants born in the Caribbean Netherlands has fallen: from 41.7% to 31.9% and from 31.7% to 23.7%, respectively. For Bonaire, both the share of persons born in the European Netherlands and the share of persons born in Central and South America have risen; for Saba, the change is primarily due to an increase in the latter group. By contrast, on St Eustatius, the share of inhabitants born in the Caribbean Netherlands has actually increased slightly (by 3.2%) relative to 2011.

Marital status
The marital status of inhabitants is defined by four categories; married, unmarried, divorced and widowed. Where the source included a category of ‘registered partner’, the relevant numbers have been added to the ‘married’ category. Chart 3.2.4 shows that, although the percentages of both married and divorced inhabitants are slightly higher on Curaçao and Aruba than on the BES islands, overall, the distribution in 2025 is comparable for the six islands. The share of married inhabitants has fallen over time on the BES islands, whereas on Curaçao it has actually increased slightly. However, for all islands, an increase is visible in the share of divorced inhabitants.
3.3 Languages
Multiple languages are spoken in the Caribbean part of the Kingdom of the Netherlands. The official languages and the most commonly spoken languages differ from island to island. Broadly speaking, the language spoken on three windward islands is English and on the three leeward islands it is Papiamento/Papiamentu. The latter language has two main variants: the one spoken on Aruba is known as Papiamento, the one spoken on Bonaire and Curaçao is known as Papiamentu. Papiamento has an etymologically-based spelling, whereas Papiamentu is spelled phonetically. Papiamento/Papiamentu is a unique language originating from a mixture of different languages, including Portuguese, Spanish, Dutch, English and various African languages.
Official languages and commonly spoken languages
On Curaçao, the official languages are English, Dutch and Papiamentu. On Aruba, Dutch and Papiamento are the official languages, while on St Maarten they are English and Dutch. On the BES islands, Dutch is the official language. Alongside Dutch, Papiamentu and English are recognised as official languages. This means that these languages may be used in education, contacts with the authorities and law.
The diversity of languages is also revealed when we look at the languages actually spoken on the islands. In the Omnibus survey of 2021 (CBS, 2021), CBS asked people on the BES islands which language or languages they speak. Multiple answers were possible (Papiamento/Papiamentu, English, Dutch, Spanish and Other). If the respondent spoke more than one language, they were asked which one they used most. Because these figures are based on a sample survey, they contain a margin of error. The results of the survey are shown in Chart 3.3.1.
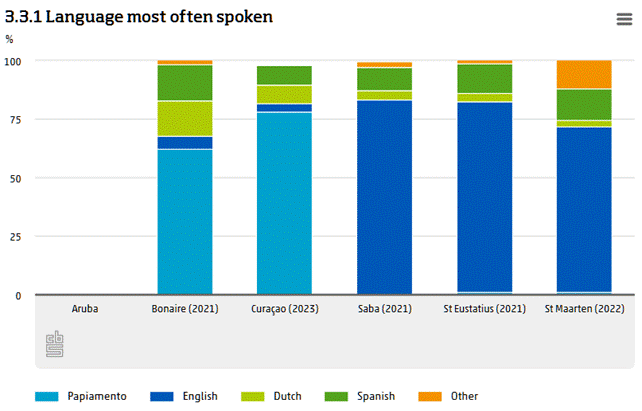
On St Eustatius, Saba and St Maarten, English is the main language spoken. On St Maarten, it is the primary language for approximately 70% of the respondents; on St Eustatius and Saba, the equivalent figure is over 80%. On Curaçao, Papiamentu is the main language spoken by nearly 80% of the population (CBS Curaçao, 2023a); on Bonaire slightly over 60% of the inhabitants use it as their main language. On Bonaire, the most common language is the least dominant.
Correlation between locations of islands and languages spoken
The islands of the Caribbean part of the Kingdom of the Netherlands were traditionally divided into ‘Leeward islands’ and ‘Windward islands’. The Leeward islands, also known as the ABC islands, are Aruba, Bonaire and Curaçao. The Windward islands, also known as the SSS islands, are St Maarten, St Eustatius and Saba. The terms refer to their location in relation to the trade winds. The Leeward islands lie off the coast of the South American country of Venezuela. The Windward islands are located more than 800 kilometres further north in the Caribbean Sea. The figures in Chart 3.3.1 display a clear correlation between the languages spoken and the locations of the islands. On the leeward islands (Bonaire and Curaçao), Papiamentu is a dominant language, while on the windward islands (St Maarten, St Eustatius and Saba) it is English.
Multiple languages
Alongside the most commonly used languages, information is also available about which other languages the inhabitants of the islands speak. On Bonaire, more than 90% of the residents speak more than one language. The survey results show that, although Papiamentu is the main language spoken, more than three-quarters of people on Bonaire also speak English and Dutch. On St Eustatius and Saba, more than half the population speak more than one language (CBS, 2022a). Here, Papiamento/Papiamentu is less commonly spoken, but approximately a third of the population speak Dutch and Spanish (CBS, 2022b).
3.4 Religion
The majority of the population of the Caribbean Netherlands, Curaçao and Aruba consider themselves to be religious. Residents are most likely to say they do not adhere to any religion on St Eustatius and Saba (22.1% and 20.4%, respectively). Catholicism is by far the biggest religion on all the islands. On the larger islands, the share of Roman Catholics is over 60%. There do not appear to have been any major shifts since 2011, except that on all the islands (for which the information is available), a larger share of the population indicated that they did not adhere to any religion in 2025.
4. Labour and education
This chapter discusses the labour market in the Dutch Caribbean. We look at how many people are in work and how high unemployment is, and how this has changed over time. We also consider the level of education of the inhabitants.
4.1 Labour force participation and unemployment
When presenting figures about the labour market, the population is often divided into three categories:
- The employed labour force. This consists of individuals who are in paid employment.
- The unemployed labour force. Those who are not in paid employment but are actively seeking work and immediately available for work.
- The non-working population. This consists of individuals who are not in paid employment, are actively seeking and immediately available for work – for example, because they are incapacitated for work or have family care responsibilities.
The employed and unemployed categories combined make up the active labour force. On the BES islands, it is common to limit the ages of the three categories to a range from 15 to 74. The upper limit is not used in the CAS countries. The institutional population (CBS, 2022) – residents of nursing homes and prisons, for example – is not included in the total. Whether or not this group is counted for the CAS countries is unclear.
Net labour force participation rate
The percentage of the population in paid employment is known as the net labour force participation rate. This is the share of the employed labour force within the total population (the active labour force and the non-working population added together).
Chart 4.1.1 shows the net labour force participation rate for the six islands for the period from 2012 to 2024. It should be noted that this chapter does not present a continuous development, given that the Labour Force Survey in the Caribbean Netherlands (Arbeidskrachtenonderzoek in Caribisch Nederland) is conducted biennially rather than annually. For St Maarten, the same years are not available as is the case for the other islands. This is why the figure shows data for 2011 for St Maarten under 2012, data for 2013 under 2014 and data for 2017 under 2016.

On all six islands, the majority of the population are in paid employment. There can be various reasons why people are not able or willing to work. On Bonaire and St Eustatius, the net labour force participation rate was over 70% in recent years. On Saba it was slightly lower, at 67%. This is due to the fact that there is a large university on the island, which means that a proportion of the inhabitants are not part of the working population (the students). Labour force participation on Aruba and Curaçao is consistently lower than it is on the BES islands. However, comparison between the CAS countries and the BES islands is impaired by differences in the age categories used. Labour force participation was faily stable for all the islands during the period under review.
Unemployment
Another important economic indicator is the unemployment rate. This is calculated by looking at the unemployed labour force. Chart 4.1.2 shows changes in the unemployment rate of the six islands. The age group categories used are the same as for labour force participation. As was seen above, the same years are not available for St Maarten as for the other islands. This is why the figure shows data for 2011 for
St Maarten under 2012, data for 2013 under 2014 and data for 2017 under 2016.
Curaçao had the highest unemployment rate throughout the period under review. It is unclear whether the different age group categories used are a factor in this. Previous studies suggested multiple reasons for the high unemployment rate on this island – for example, the general functioning of the economy on Curaçao, the heavy dependence on a limited number of industries (lack of diversification) and the functioning of the labour market (for example, bureaucratic obstacles and delays in the licensing procedure). For more information about the labour market on Curaçao, see the analysis of the labour market on Curaçao (CBS Curaçao, 2023b). Nevertheless, unemployment on this island has fallen relative to 2016, with the exception of the spike during the coronavirus pandemic. Whereas in that year the unemployment rate was over 13%, by 2024 it had fallen below 8%.
Unemployment has also fallen on Aruba and Bonaire in recent years – from more than 7% in 2016 to slightly over 4% in 2024 on Aruba, and from more than 6% in 2016 to approximately 2% in 2024 on Bonaire. Saba has had the lowest unemployment rate in virtually all years. In 2024, unemployment on the island stood at under 2%. Saba also had the lowest unemployment rate in previous research conducted by CBS (Hermans and Kösters, 2019). Unemployment on St Eustatius have been fluctuating somewhat. The economy on this island is heavily influenced by a small number of large enterprises. Their production is mainly export-oriented and dependent on the regional oil sector.
Because all the islands are popular holiday destinations, the tourism, trade and accommodation & food service sectors are those that provide the most employment. However, each island has a different sector structure. More detail on this is provided in chapter five.
4.2 Level of education
In this section, we look at the highest level of educational attainment of the inhabitants of the six islands. Chart 4.2.1 shows the highest level attained for those islands for which the information was available. The information relates to 2016 and the most recent available year: 2024.
Three categories are defined for the highest level of educational attainment: ‘primary education/prevocational secondary education (VMBO) or senior secondary vocational education (MBO) 1’; ‘senior general secondary education (HAVO)/pre-university education (VWO) or senior secondary vocational education (MBO) 2-4’; and ‘higher vocational education (HBO) or university education’. A more approximate categorization was used for St Maarten and Curaçao.

The most common highest level of educational attainment for residents of the islands is ‘primary education/VMBO or MBO 1’ – this is true for between 30% and 50% of the population on the islands of Bonaire, St Eustatius and Curaçao. Approximately 15% to 25% of residents have either an HBO or university qualification. Saba presents a different picture: the percentage of residents with an HBO or university education is relatively high here, at over a quarter. This is due to the large medical university situated on the island. Due to the rounding off of percentages in the source, not all countries add up to 100%. As a result, the figures are indicative.
The level of education of the BES islands has changed slightly since 2016. These days, a smaller share of the population have ‘primary education/VMBO or MBO 1’ as their highest level of educational attainment. Older figures are not known for the other islands.
A familiar problem is that young people from the islands in the Caribbean part of the Kingdom of the Netherlands leave to study elsewhere, for example in the European Netherlands, and do not return to directly where they came from after completing their study programmes. For example, estimates suggest that hundreds of young people leave Curaçao every year to study elsewhere but that only approximately 5% return to the island after their studies (CBS Curaçao, 2023c). The most recent survey of school pupils on the BES islands (Bokern and Fernandez Beiro, 2025) also saw a large proportion indicating that they wanted to leave the island in the future to live elsewhere. This was true for 81% of young people on Bonaire, with the figure rising to 91% for Saba and St Eustatius. On all three islands, ‘to complete a training course or study programme’ and ‘to see more of the world’ were the most common reasons given for wanting to leave.
The result of the departure of these young people is that the average educational level of residents of the six islands is relatively low. By way of comparison: in the European Netherlands (CBS, 2025b), slightly over a quarter of individuals aged 15 to 75 have ‘primary education/VMBO or MBO 1’ as their highest level of educational attainment, approximately 41% have ‘HAVO/VWO or MBO 2-4’, and nearly a third have ‘HBO or university education’. The permanent departure of those with HBO and university educations can have an impact on the local labour market and on the economies of the islands. It can potentially also affect the composition of the population, for example because migrants have to be hired to fill job vacancies.
5. Economy and tourism
In this chapter, we examine the economies of the six islands. How big are the economies and what levels of economic growth have been seen in recent years? What are the main industries on the different islands? Finally, we look at inflation.
5.1 Gross domestic product
Gross domestic product (GDP) is a commonly used measure for the size of an economy. GDP is roughly equal to what is produced, earned or spent within a country. The Caribbean Netherlands Macroeconomic Context Monitor Baseline Measurement (Nulmeting monitor macro- economische context Caribisch Nederland – CBS, 2024) provides more information on how GDP is measured. Per capita GDP is a narrower measure of economic prosperity. ‘Well-being’ is not addressed in this article. Before considering GDP, we first discuss the differences in currencies.
Currency
Not all of the islands use the same currency. As of 2025, the official currency of Curaçao and St Maarten is the Caribbean guilder. This is the successor to the Netherlands Antillean guilder and came into circulation on 31 March 2025. The currency of Aruba is the Aruban florin. It was introduced after Aruba gained status aparte within the Kingdom of the Netherlands in 1986 (previously, the Antillean guilder was also used here). The US dollar has been the official currency on the BES islands since 1 January 2011. Tourism and trade played a role in this decision. In order to be able to compare the size of the economies of the six islands, all amounts have been converted to US dollars.
As Chart 5.1.1 shows, Aruba and Curaçao have a larger economy; the other economies are much smaller. This partly reflects the size of their populations: the more inhabitants, the more people there are to produce and consume. However, this is not the only factor. For instance, although Aruba does not have the largest population, it does have the highest GDP. In order to compare prosperity levels between the islands, GDP per capita is generally used. As may be seen in Chart 5.1.2, this is by far the highest on St Eustatius (2021 figures). The levels on Bonaire, Saba and Aruba are fairly comparable, while on Curaçao and Sint Maarten they are substantially lower. The figures have not been corrected for differences in purchasing power (the equivalent of 1 US dollar buys more on one island than on another).
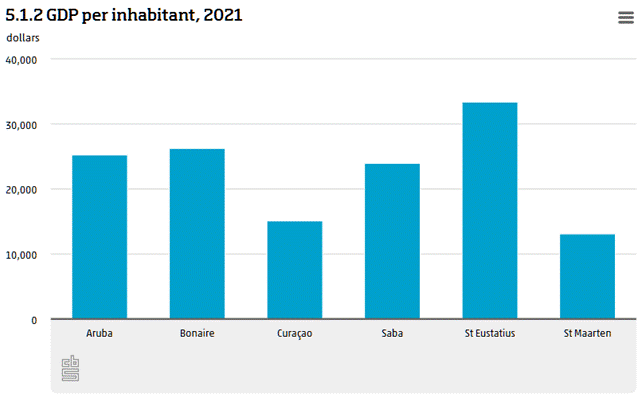
5.1 Changes in GDP
Chart 5.2.1a shows changes in the volume of GDP relative to the year before, a measure of economic development. An obvious negative outlier is the year 2020, when the economies of all six islands contracted. In that year, travel restrictions were in place due to the coronavirus pandemic, which had a major impact on tourism. However, the following year saw a strong recovery. It is striking that the economy of St Eustatius fluctuates significantly. This is related to the island’s dependence on a small number of large enterprises. It also means that the per capita GDP presented in the previous section is highly dependent on the year chosen for comparison.
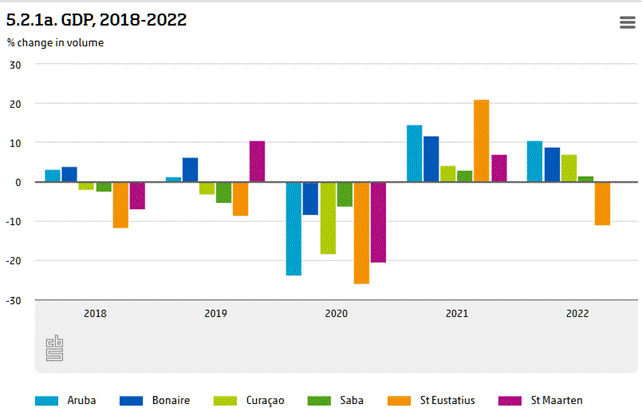
In order to gain more insight into growth over the longer term, the changes in GDP volumes have been indexed from 2013 in Chart 5.2.1b. For Aruba and St Maarten, the first years in the series are missing. For these islands, the graph therefore begins later, at the average index of the other islands for that year. The figure reveals that Bonaire’s GDP has risen the most since 2013, and that the GDP of St Eustatius has contracted. The economies of the other islands have grown slightly; there is little divergence between them. Compared to the European Netherlands, growth since 2013 has been modest: in 2022, the GDP of the European Netherlands was nearly a quarter above that of 2013.
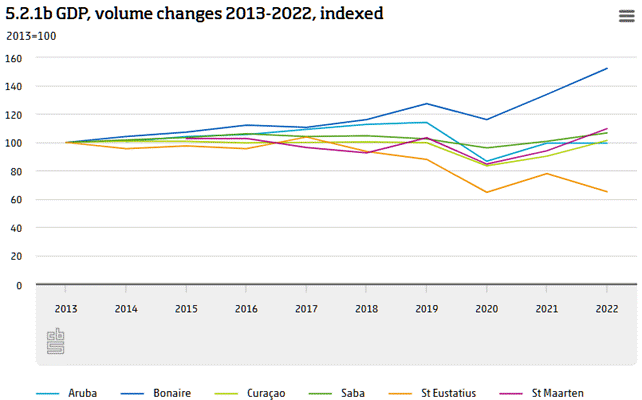
5.2 Gross value added by industry
For the four largest islands, information is also available on gross value added by industry. This provides insight into the structures of the economies and whether, for example, they are dependent on a limited number of industries. The figures are shown for 2021, the most recent year for which the figures are known for all four of the larger islands. This information is not available for St Eustatius and Saba because CBS is bound by rules on disclosure. This means it is not possible to publish the figures for certain industries on St Eustatius and Saba. However, the year chosen fell in the middle of the pandemic, and the figures may present a distorted picture as a result. Figures are not available for the period immediately after the constitutional reform.
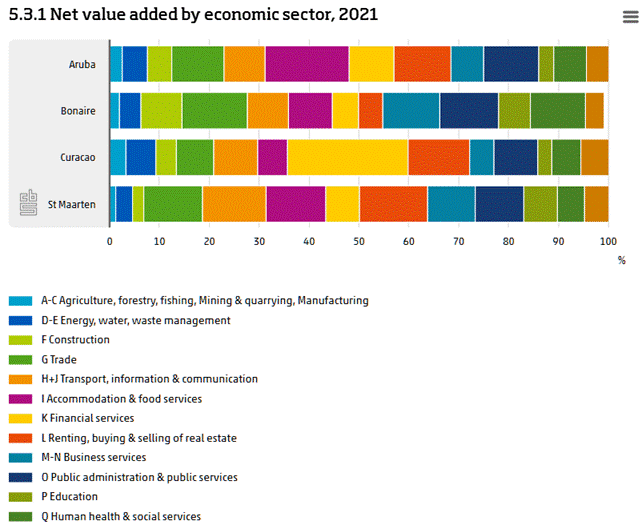
R-U Culture, recreation & other services
As Chart 5.3.1 shows, financial services are very important to the local economy on Curaçao. This sector accounts for almost a quarter of the island’s total value added. It encompasses a number of banks, insurance companies and other financial institutions. The importance of tourism for all four of the islands is clearly demonstrated. For example, accommodation & food service is the most important sector on Aruba. Trade is also a relatively large sector on all the islands – this includes retail trade, such as shops and markets. Tourism also acts as a stimulus for business services, for example car rentals and travel agent services.
5.3 Tourism
As stated in the previous section, tourism is one of the most important sectors on all the islands in economic terms. In order to provide a picture of changes in the numbers of tourists on the islands and how the different islands compare, Chart 5.4.1 shows the number of cruise passengers for the period 2011 to 2023 (the major cruise companies do not call in St Eustatius or Saba). Cruise ships are an important source of income for many of the islands. What stands out in particular are the devastating effects of the coronavirus pandemic. After three bad years, passenger numbers finally returned to pre-pandemic levels in 2023.
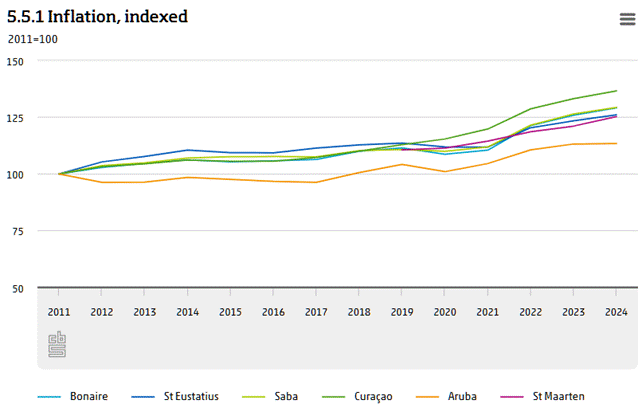
St Maarten receives by far the most cruise passengers. As such, the downturn caused by the pandemic was most severe for St Maarten. The number of tourists coming to Bonaire by cruise ship is generally much lower than for the CAS countries.
5.4 Inflation
This chapter concludes by taking a look at inflation. Inflation is the average increase in prices of consumer products. In order to be able to measure inflation properly, we first need to identify what residents of the islands spend their money on. We then look at the cost of the goods and services that residents buy. CBS obtains this information for Bonaire, St Eustatius and Saba from written surveys, internet monitoring and external records, while some of the prices are documented by interviewers going from store to store. More information on how CBS measures inflation can be found in the Macroeconomic Context Monitor Baseline Measurement (CBS, 2024).
Because the methods used to chart inflation are not uniform, this can affect the comparability of the results. Inflation can also be influenced by differences in consumer spending patterns. This needs to be taken into account when interpreting the figures below. The periods for which the figures are available also differ substantially between the islands. For instance, the figures for Curaçao go back to 1970, while for St Maarten they are only available from 2019. Chart 5.5.1 shows inflation indexed from the constitutional transition (2011). For St Maarten, an index has been taken for the first available year equal to the average of the other islands in that year.
As Chart 5.1.1 shows, prices have risen by the most on Curaçao. Prices were 36.6% higher there in 2024 than in they had been in 2011. This is still slightly lower than the European Netherlands, where prices rose by 39%. Aruba saw the smallest increase in prices, at 13.4%. For most of the islands, inflation fluctuates around 2% annually, with 2022 as an obvious outlier. On all the islands in the Caribbean part of the Kingdom of the Netherlands, inflation was much higher in that year, ranging from 3.6% on St Maarten to 10% on Bonaire. Increased inflation was a global phenomenon. The most frequently cited causes of this global spike in inflation are the post-pandemic economic recovery and Russia’s invasion of Ukraine.
The inflation figures are also relatively high for the years immediately following the constitutional transition in 2010. Research has been conducted into the possible causes of these price rises in the Caribbean Netherlands (Ecorys and Curconsult, 2017). After the reform, changes were implemented to various systems (tax, customs, care, social security) in a relatively short time-frame. These changes brought an element of uncertainty. This, in combination with the switch from the Antillean guilder to the US dollar, resulted in an upward price effect. There were also macro-economic causes for the relatively sharp price rises in this period, such as high oil and food prices and fluctuating exchange rates. Moreover, there was unrest in Venezuela, an important supplier.
6. Conclusion
The total population of the Caribbean part of the Kingdom of the Netherlands has grown by a little less than 10% since the constitutional reform, to 340 thousand inhabitants in 2025. This rise is largely due to an increase in the population of Bonaire, which has grown by nearly 70% (11 thousand residents) since 2011. The increase in the population of Bonaire is largely attributable to the fact that more people have moved to the island than have left.
The average age of the population is higher than it was fifteen years ago. All of the islands are home to more people aged 65 and over than in 2011 or a comparable year. The rise in the number of older people has been most pronounced on Curaçao; the number of those aged 65 and over there increased from 13.8% in 2011 to 25.3% in 2025.
Many island residents do not originate from the islands themselves: one-third of the inhabitants of Bonaire, St Eustatius and Saba in 2024 were actually born within the BES region. For Bonaire and Saba, the proportion of residents born in the Caribbean Netherlands declined by 10 and 8 percentage points, respectively. More people with origins in the Netherlands or Central and South America have moved to those islands. For Aruba (62%) and St Maarten (41.6%), the share of residents born within the CAS area is much higher.
On all six islands, the majority of the population are in paid employment. However, labour force participation is consistently lower in the CAS countries than on the BES islands, and unemployment is higher. Nevertheless, unemployment has fallen on all the islands in recent years. A familiar problem on the islands is that young people from the Caribbean part of the Kingdom of the Netherlands leave to study elsewhere, for example in the European Netherlands, and do not return to the islands after completing their study programmes. The result of the departure of these young people is that the average educational level of residents of the six islands is relatively low. The permanent departure of those with higher vocational (HBO) and university educations can have an impact on the local labour market and on the economies of the islands.
GDP per capita is clearly highest on St Eustatius and lowest on Curaçao and St Maarten, while that of the other three islands is comparable. The economy of St Eustatius has displayed the slowest growth since 2013, while Bonaire’s economy has grown the fastest. Since 2011, prices have risen fastest on Curaçao and slowest on Aruba.
Sources
Bokern, Paul and Linda Fernandez Beiro, 2024, Young people in the Caribbean Netherlands: Student survey results
CBS, 2020, Definition of institutional households
CBS, 2021, Omnibus survey Caribbean Netherlands
CBS, 2022b, Caribbean Netherlands; Spoken languages and main language, characteristics
CBS, 2023, CBS meerjarenprogramma Caribisch Nederland 2024-2028 (only available in Dutch)
CBS, 2024, Nulmeting monitor macro-economische context Caribisch Nederland
CBS, 2025a, Caribbean Netherlands; population, births, deaths, migration
CBS, 2025b, Caribbean Netherlands; students by MBO level, sector and domain
CBS Curaçao, 2023a, Population by most spoken language at home
CBS Curaçao, 2023b, Analysis of Curaçao’s labour market (only available in Dutch)
CBS Curaçao, 2023c, Educational attainment and Outcome in Curaçao
Ecorys and Curconsult, 2017, Research into prices in the Caribbean Netherlands (only available in Dutch)
Hermans, Brigitte and Lian Kösters, 2019, Labour force on the islands of the Caribbean Netherlands (only available in Dutch)
World Bank, 2025, Inflation, consumer prices



GIPHY App Key not set. Please check settings